Overview
We will look at the voting-eligible population (VEP) turnout data in presidential elections from the U.S. Elections Project from 1980 to 2020. The goal is the see how states and regions vary in voter turnout in this longitudinal dataset. The data was downloaded and edited, and plotted in graphs in RStudio. The charts were then finalized in Affinity Designer.
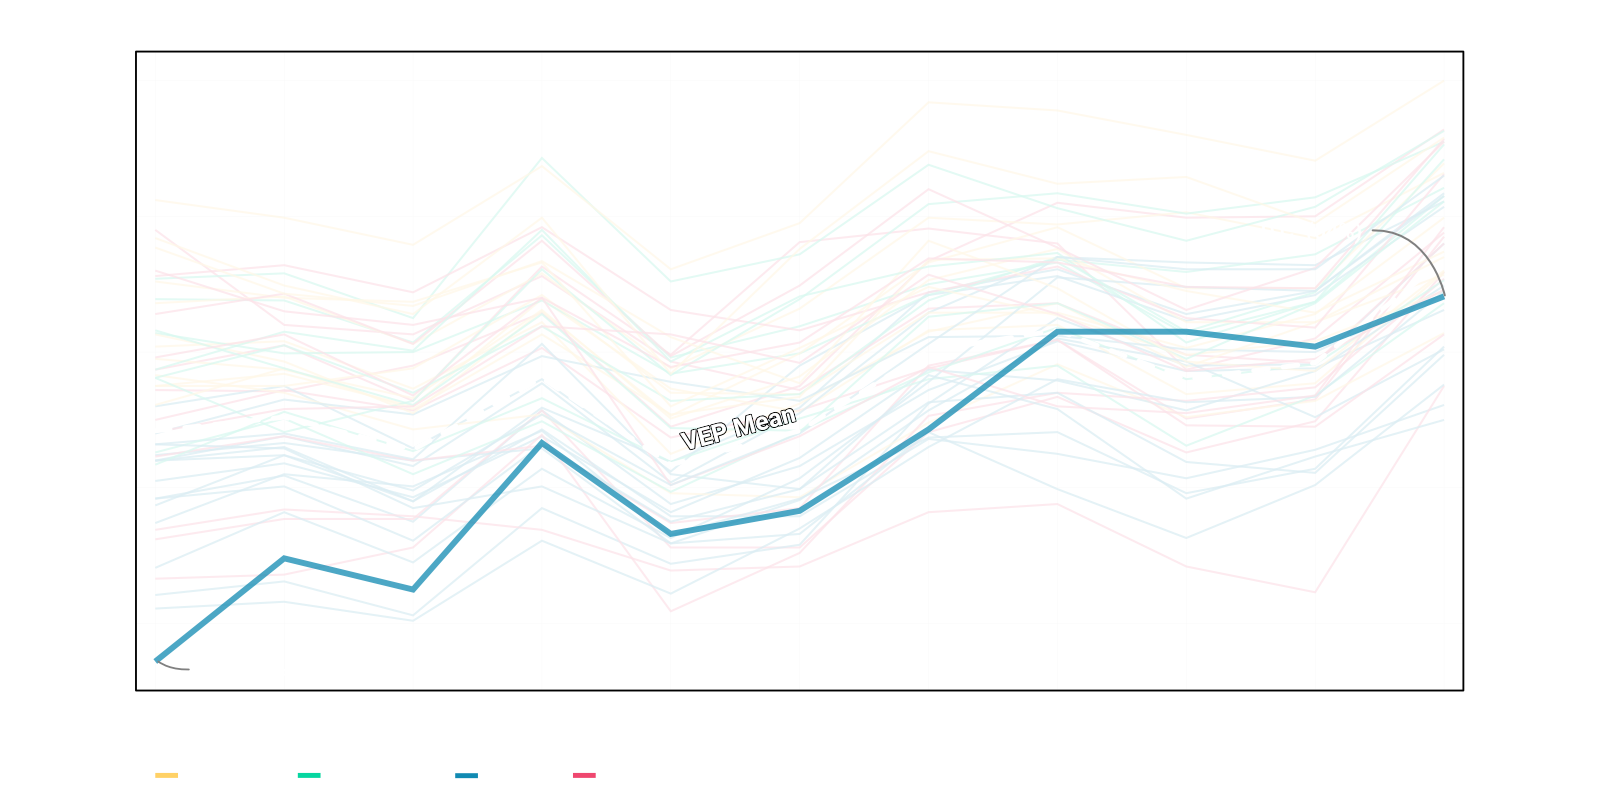
National Level
In the 2020 presidential election, the U.S. voter turnout rate (VEP) was 66.8%. This rate was the highest in the dataset. The 2020 election turnout was 5 points higher than the next closest rate of 61.6% in 2008. The lowest turnout rate of 51.7% was posted in 1996. However, since 1996, the overall turnout rate has gained over 15 points.
State Level
In 2020, Minnesota had the highest turnout rate of 80%, whereas Oklahoma had the lowest rate of 55%. Yet, it should be noted that 2020 was also the first election in the dataset where all state turnout rates (including D.C.) exceeded 50%. In other words, 2020 was the first presidential election (in the series) where the majority of eligible voters in every state voted.
Interestingly, Minnesota has had the highest voter turnout rates for 10 out of the 11 elections since 1980, with the exception of 1992, when Maine briefly posted the highest VEP of 74%. On the other end of the spectrum, Hawaii had the lowest turnout rates from 2000 to 2016, preceded by Nevada in 1996 (41%), South Carolina from 1984 to 1992, and D.C. in 1980 (37%).
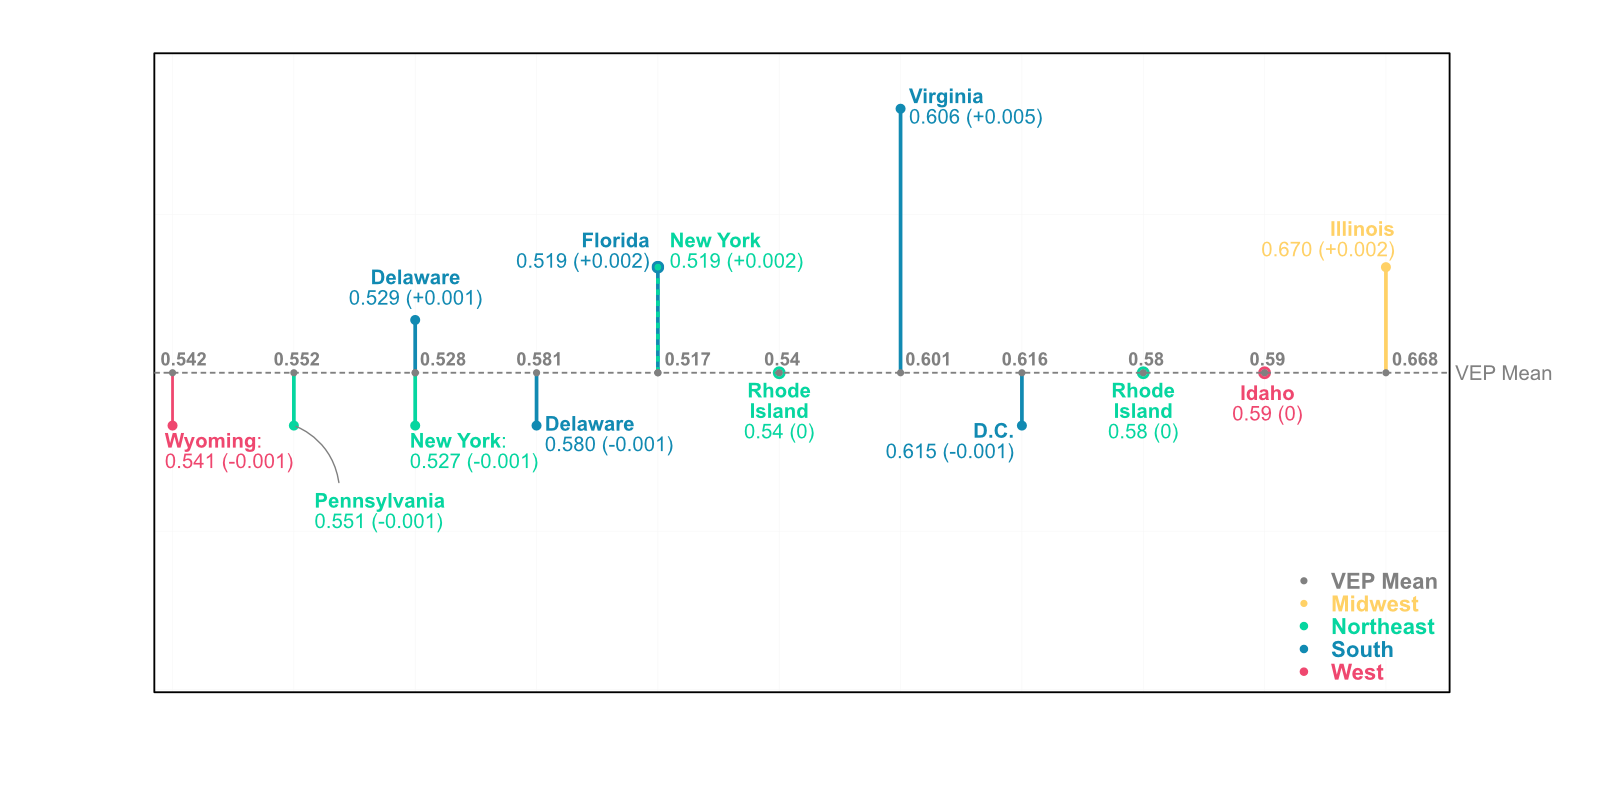
Which states were closest to the mean VEP for a given election? With a bit of help from StackOverflow, I was able to modify a line of code in RStudio to find the answer. The results are shown in the plot above. Matches are run to three decimal places. Rhode Island has matched the national turnout rate twice (2000, 2012), and Idaho matched the mean once (2016). In 1988, Delaware and New York were both equal distances from the mean in absolute units. And in 1996, Florida and New York posted the same turnout rates.
My modified code is posted below.
FindAvgStateVEP <- df %>%
group_by(Election.Year) %>%
slice(which(abs(National.VEP - State.VEP) == min(abs(National.VEP - State.VEP))))
group_by(Election.Year) %>%
slice(which(abs(National.VEP - State.VEP) == min(abs(National.VEP - State.VEP))))
Regional Level
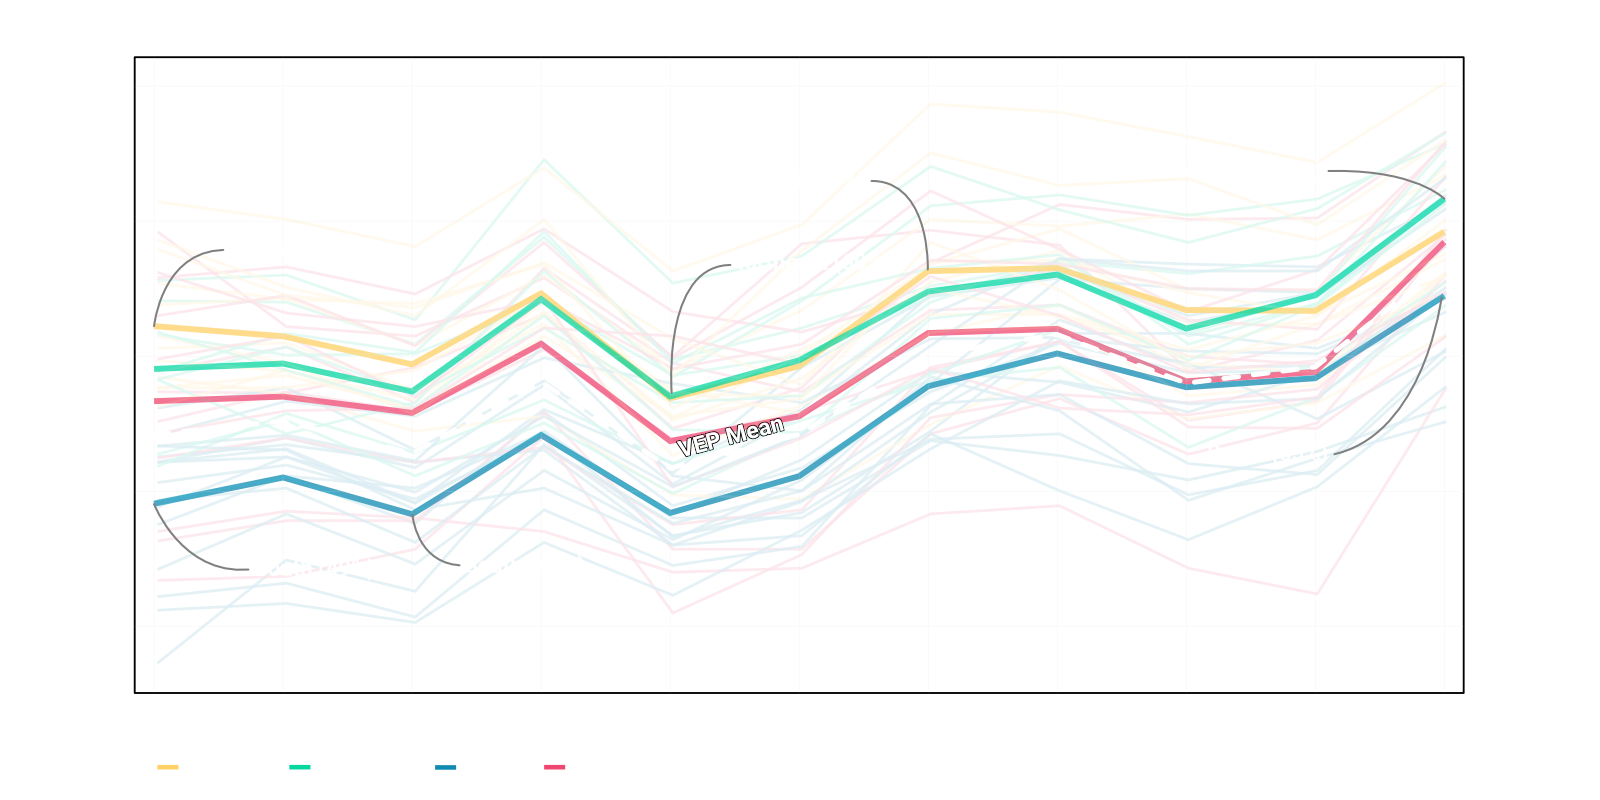
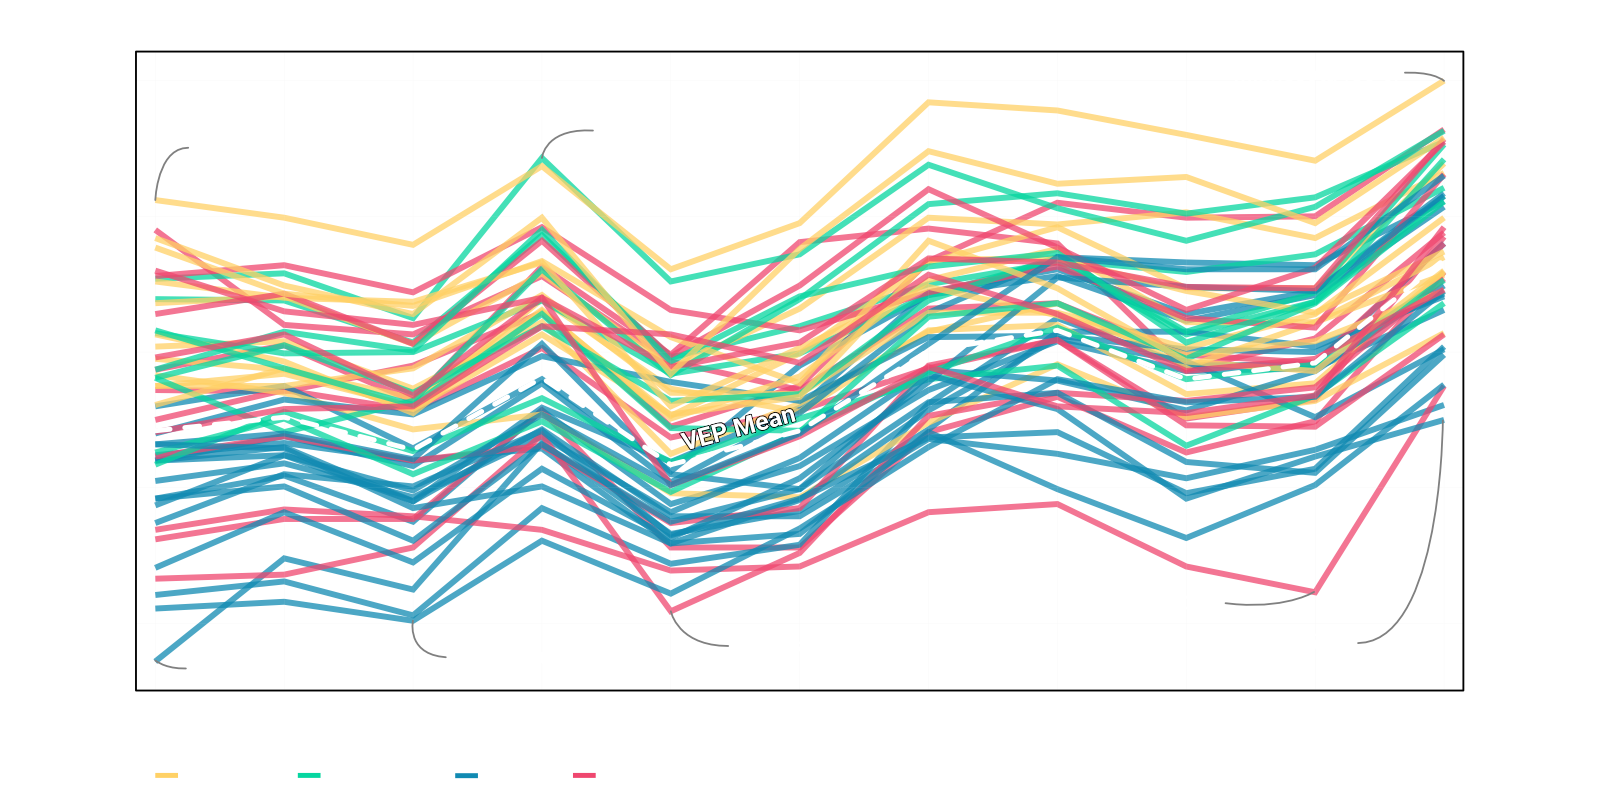
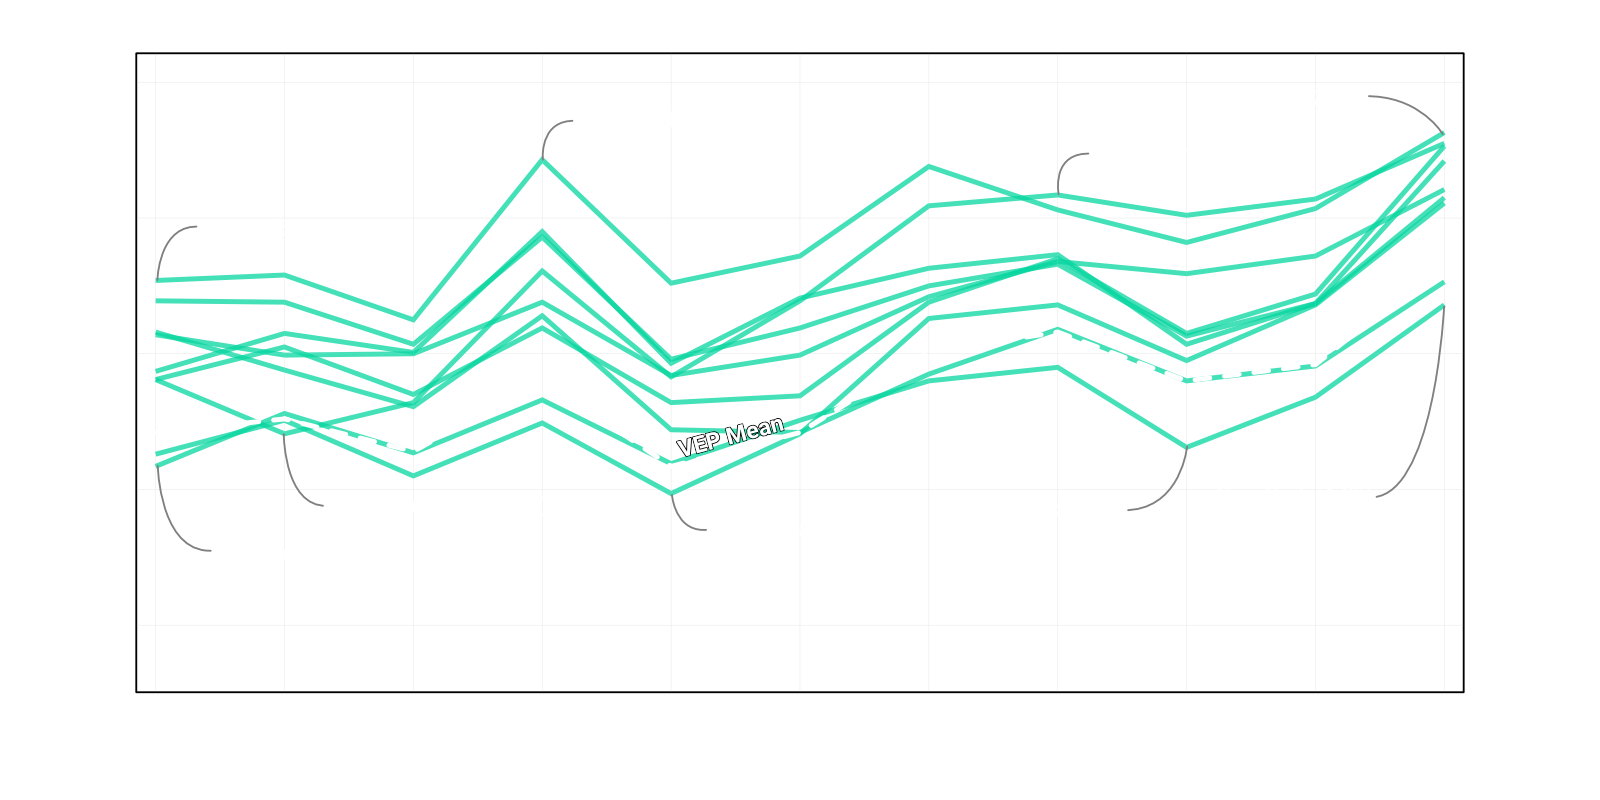
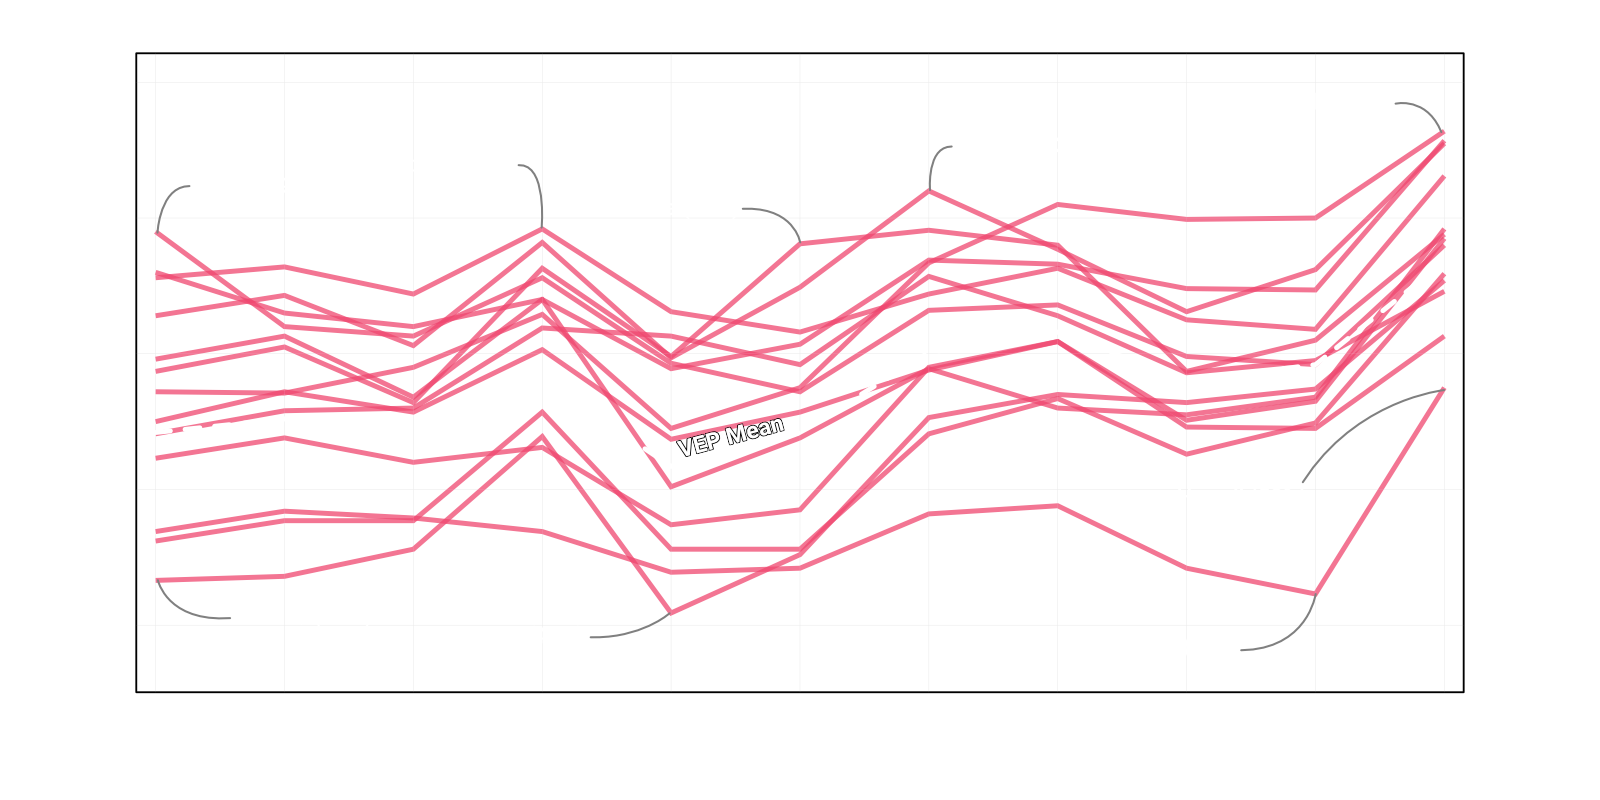
Comparing the regions, in 2020, the Northeast had the highest mean VEP with 72%, the highest in this series. The Midwest led the regions in turnout for seven elections out of 11. In 2016, the Northeast overtook the Midwest. Neither the Northeast nor the Midwest has fallen below 50% nor the national mean.
In most elections, the regional VEP rates tend to trend in the same direction. The notable exceptions are the Midwest from 1980–84 and 2012–16. It is also interesting that for most years, the Midwest, Northeast, and West regions are above the mean U.S. turnout rate, whereas the South is below the mean.
In fact, the South was the only region to post below 50% turnout in this dataset. Since 1996, the South has closed the turnout gap; however, since it is the most populous region (nearly 40% of the total population), it is unlikely to exceed the average turnout rate without one or two regions falling below it.
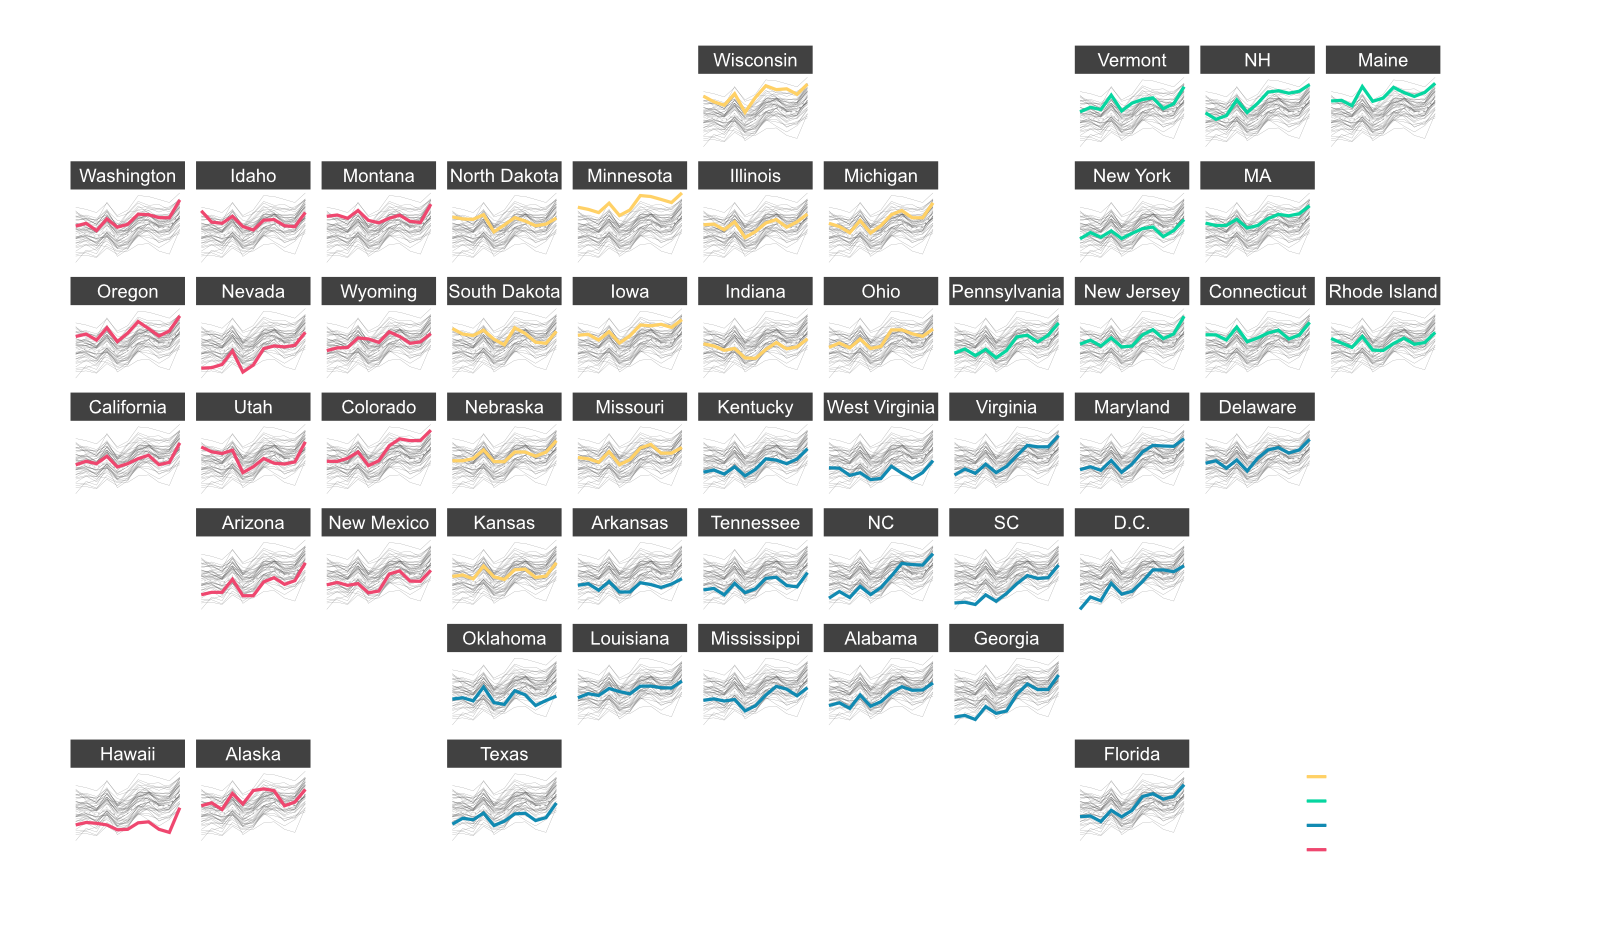
States by Region
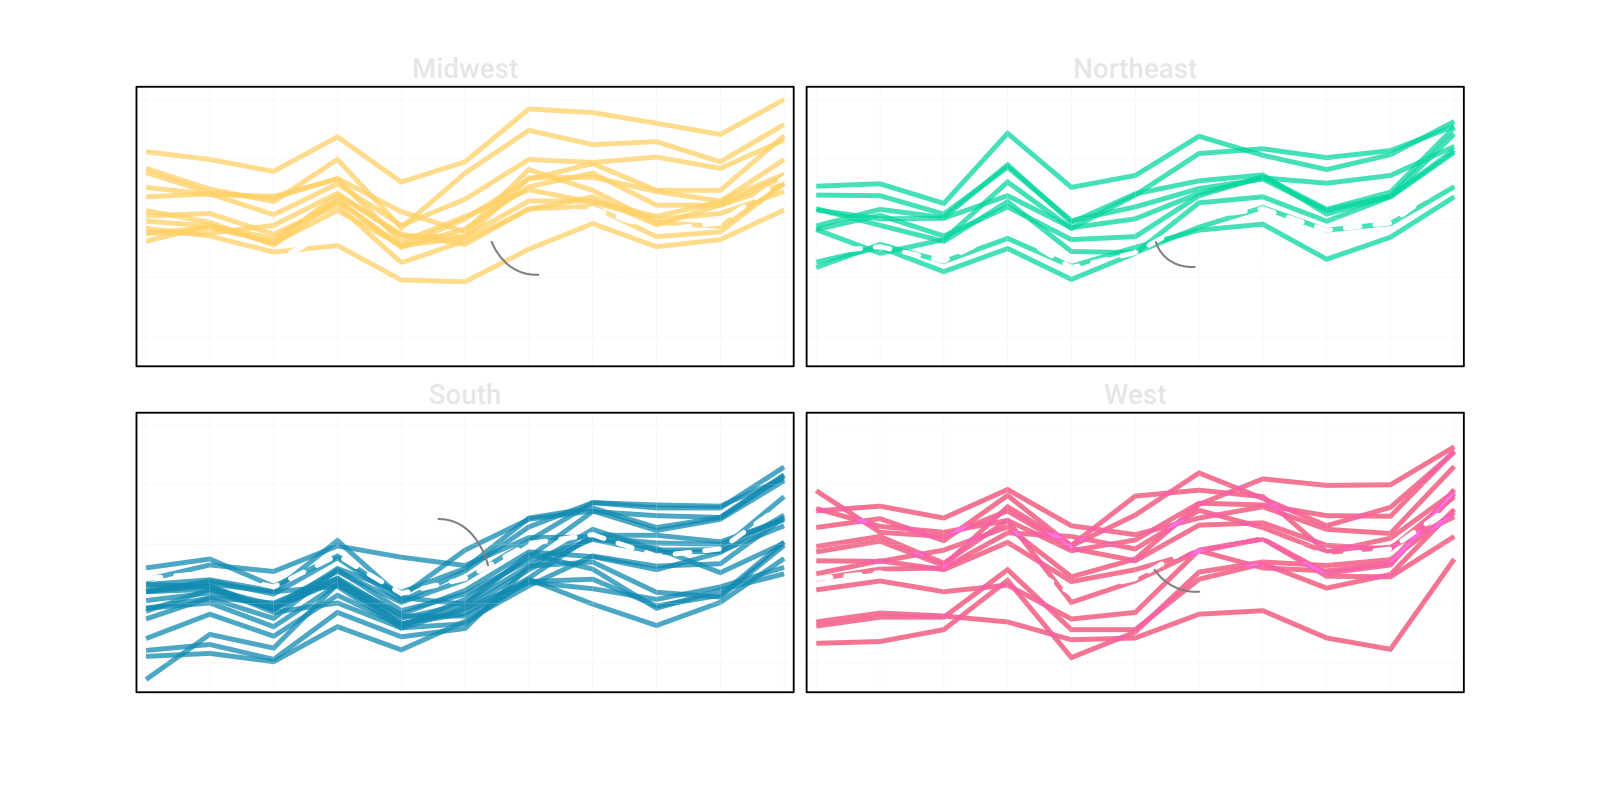
Breaking down each region by their respective states, we can see that all but one or two Midwest and Northeastern states exceed the national mean for most years. Conversely, most Southern states were below the national mean for most elections until 2000. And Western states seem to be about average, minus a straggler or two.
Southern States
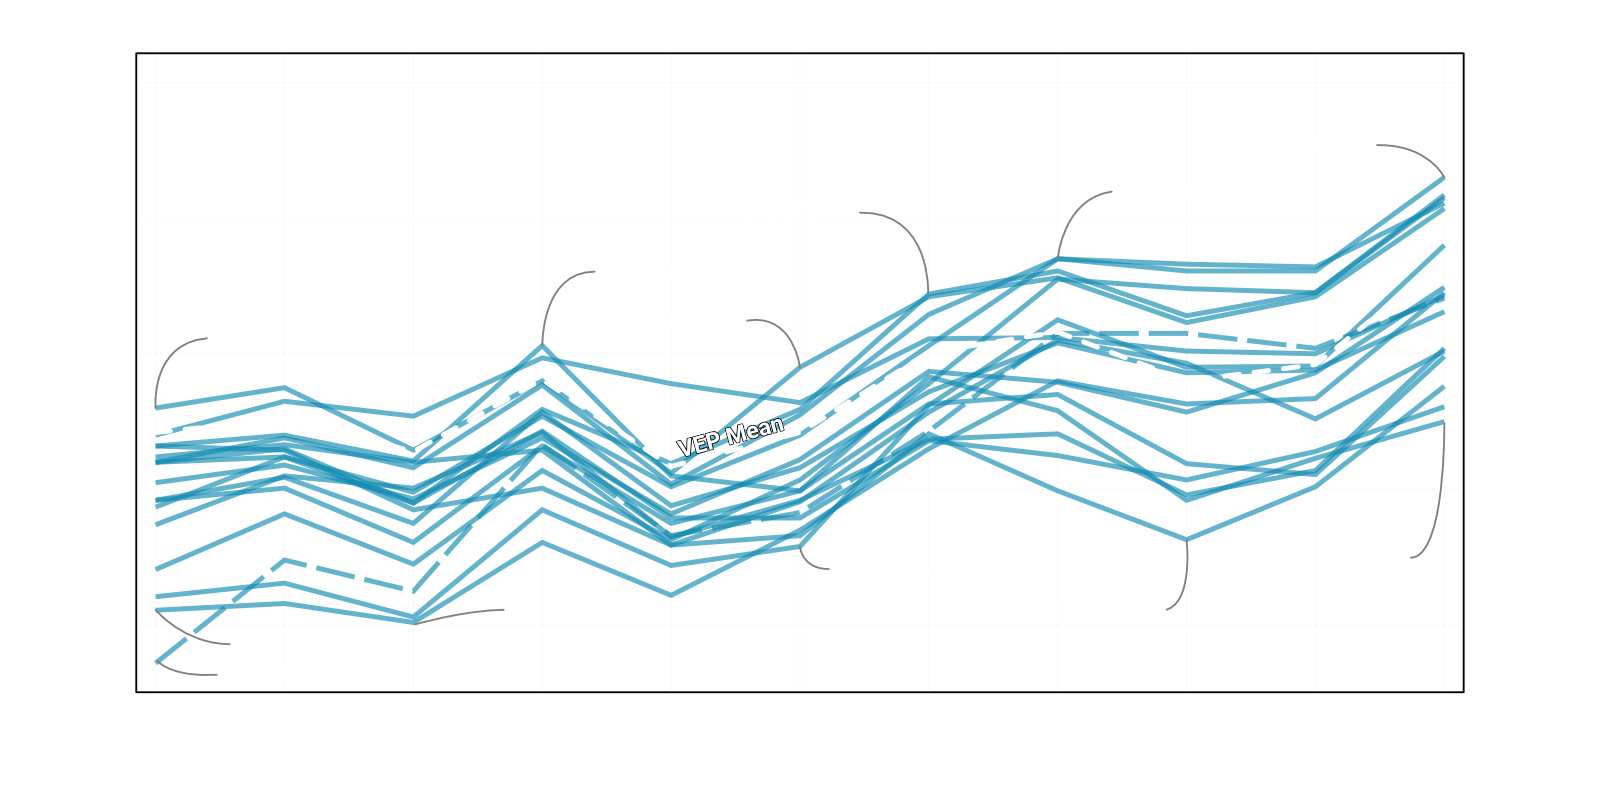
In 1980, nearly every southern state was below the national mean of 54%, except for Delaware*. Only two states in 1984 and 1988 (Louisiana, Delaware) exceeded the mean; two in 1992 (Louisiana, Oklahoma), two in 1996 (Louisiana, Florida), and four in 2000 (Louisiana, Delaware, Florida, Maryland). And in 2020, six states out of 16 were above the national mean. Only in 2012 did a majority of Southern states (9) exceed the national mean.
*The Census Bureau considers Delaware and Maryland to be in the South region.
Delaware had the South’s highest turnout rate for three elections (1980, 1984, and 2000), and Maryland had the highest rates from 2008 to 2016. Maryland also posted the highest rate above the mean for the region in the dataset (+8 points) in 2012. And Virginia had the highest turnout rate among the Southern states (73%) in 2020.
The gap between the highest and lowest VEPs in the South was relatively wide, beginning the series at 19 points, or the third highest of the regions. The VEP gap improved to a nation-leading 11 points in 2004, which was also the lowest gap in the series. The widest gap in the South occurred in 2012 (20 points) and as of 2020 sits at 18 points, the second lowest of the regions.
Excluding Delaware and Maryland, Louisiana was the South’s top performer from 1980 to 1988, 1996, and 2000. Excluding the border states would make Louisiana’s 1980 rate of 54% the only regional leader to have a turnout rate below the national mean. In 1992, Oklahoma's rate of 60% was the highest in the South and higher than the national mean by 2.5 points. Florida became the leader in 2004 with a rate of 64%. And since 2008, Virginia has had the highest VEP in the region with a minimum of 5 points above the mean. Notably, Virginia’s turnout has improved by 24 points since 1980.
And excluding Washington D.C., South Carolina posted the lowest VEP in the South from 1980 to 1996 and 2004. From 1980 to 1996, South Carolina was at least 12 points below the national mean. Georgia briefly had the lowest spot in 2000 with a rate of 46%, 8 points below the mean. From 2008 to 2016, West Virginia occupied the lowest position, with a VEP below the mean by 12 points (2008, 2012) and 9 points (2016). And in 2020, Oklahoma had the lowest turnout rate in the region (55%), around 12 points below the national average. Oklahoma was one of two states to post the highest and lowest VEPs for their respective regions (New Hampshire is the other).
District of Columbia
In 1980, Washington D.C. posted the lowest turnout rate in the country, as well as the entire dataset, 37%, which was 17 points below the national mean. In 1984/88, D.C. had turnout rates 10 points below the national mean. In 1992, D.C. briefly exceeded 50% turnout before dropping below the majority threshold for two elections. Since 2004, a majority of eligible voters in Washington D.C. continued to cast a ballot, and in 2012, D.C. exceeded the national mean for the first time in the series (+3 points). And in 2020, D.C. posted its highest VEP in the dataset (64%), a 27-point gain from 1980, even if it was nearly 3 points below the national mean.
Midwestern States
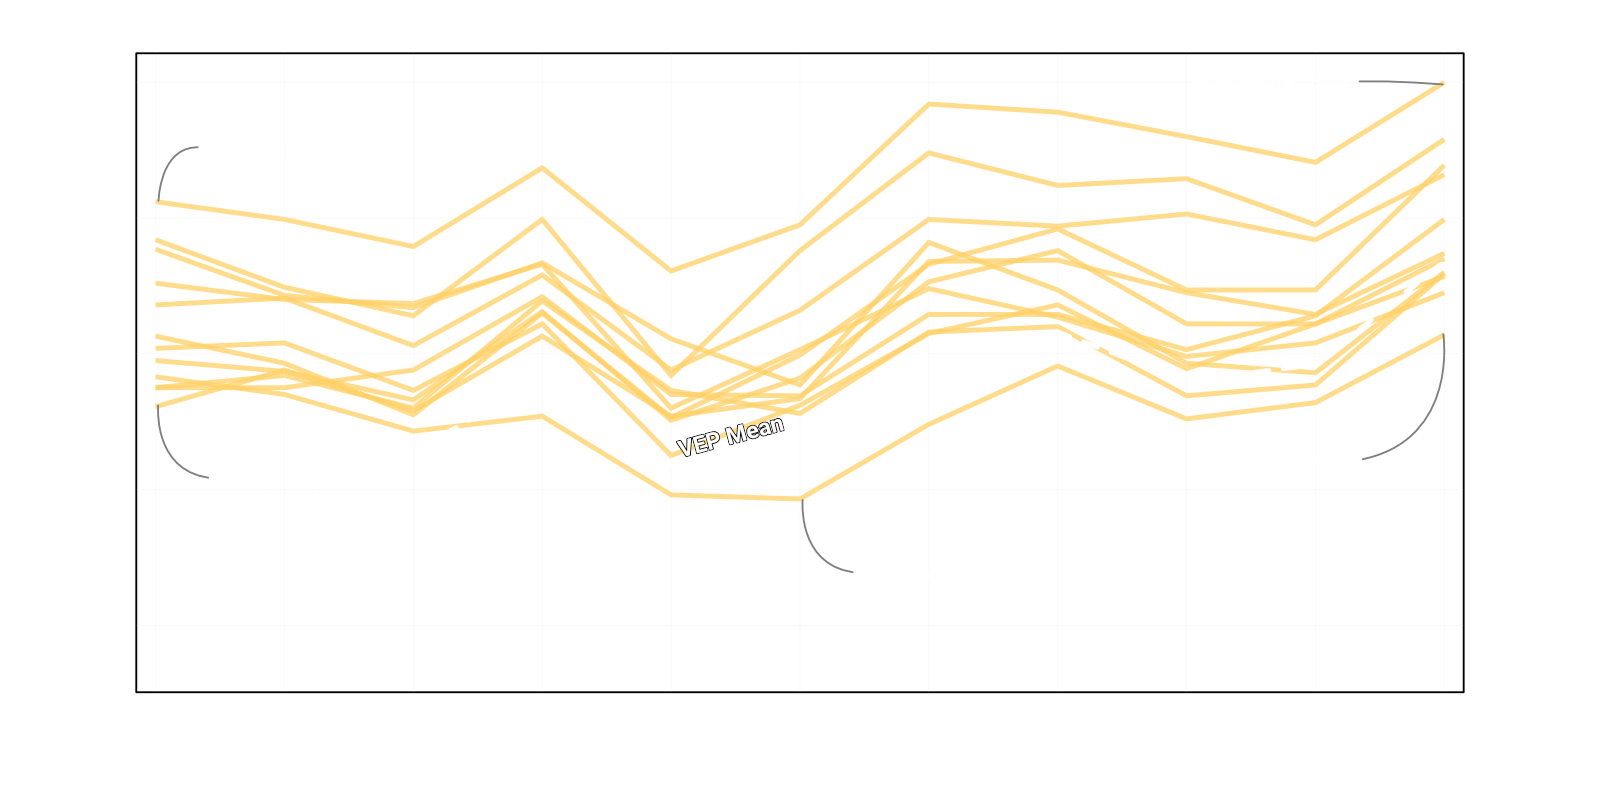
From 1980 to 1988, every Midwestern state exceeded the national mean turnout rate. Minnesota has led the Midwest in turnout for every election in the dataset, with rates far above the mean. In 2004, Minnesota’s turnout rate of 78.4% was over 18 points above the national mean, its highest lead in the series. Minnesota has maintained a VEP above 70% since 2004, reaching a peak of 80% in 2020; however, its lead above the national mean dropped to 13 points as the national rate climbed to 66.8%. Minnesota has averaged a turnout rate of 73% in presidential elections from 1980–2020.
Ohio began the series with the lowest VEP in the Midwest (56%) However, since 1984, Indiana has posted the lowest turnout rate in the region. Indiana’s VEP dropped below the national mean in 1992 and has remained below it ever since. This shift is a combination of Indiana’s turnout dropping approximately three points in 1988 (54.3%) and only rising slightly by one point in 1992, slower than the national rate.
In 2012, Kansas joined Indiana by dropping below the mean and has also remained ever since. This trend is in spite of the fact that Kansas’ turnout has increased every presidential election, including an 8-point jump in 2020 to 66%. And by 2020, North and South Dakota both dropped below the national mean despite turnout rates in the mid-60s.
Illinois, the most populous state in the Midwest, began the series six points above the mean but has since fallen to 1 point above by 2020. From 1996 to 2020, Illinois averaged around 1.5 points above the national average.
Northeastern States
From 1980 to 2004, the Northeast was led by Maine, with an average turnout rate of 68%. During this period, Maine reached a peak turnout of 74% in 1992, 16 points above the national mean. In 2008, New Hampshire had the highest turnout rate (72%) as Maine’s VEP dropped by 3 points to 71%. Maine’s turnout declined again in 2012. New Hampshire remained the leader until 2020, when Maine returned to the leaderboard with a VEP of 76%.
The Northeast’s underperformers are also its most populous states: New York and Pennsylvania. New York has had the lowest turnout rate in the region for six elections out of 11 and has occupied the bottom slot since 2000. In nearly all but three elections, New York has trailed the national average, and when it did exceed the mean, it was by less than a point. In 2020, New York’s VEP was also its highest in the series (64%), a gain of 7 points from 2016; however, it still trailed the national mean by 3 points.
From 1988 to 2000, Pennsylvania had the lowest turnout rate in the Northeast, averaging a rate of 52% during this period and 58% overall. Like New York, PA tends to hover around the national mean with the exception of 1992 (-3 points), 2016 (+4 points), and 2020 (+4 points). In 1984, New Hampshire had the lowest turnout rate in the Northeast (54%), which was one point below the national mean.
The Northeast has also had the narrowest spread between its high and low VEP states. The narrowest gap occurred in 1988 (12 points). The region has had the lowest turnout gap for six of the eleven presidential elections in the dataset. In 1992, the Northeast had its widest gap of 19 points, which coincided with Maine's second-highest VEP rate of 74%. However, since 2008, the region has led the nation with the narrowest VEP gap.
Western States
In 1980, Idaho led the Western states in voter turnout with a VEP of 69%, over 14 points above the national mean. Idaho’s turnout dropped 7 points in 1984, giving Montana the highest rate in the region at 66%. Montana would remain the leader in the west from 1984 to 1996. In 2000, Alaska had the highest rate of 68%, which was 14 points above the national mean. In 2004, Oregon posted the highest turnout rate, with 72% of voters casting a ballot. And since 2008, Colorado has led the Western states, achieving a peak turnout rate in the dataset for the region of 76% in 2020.
From 1980 to 1988, Nevada had the lowest VEP rates in the West; each election had below 50% turnout. In 1992, Hawaii had the lowest turnout at 47%, 11 points below the national mean. Nevada regained the lowest position in 1996, with a rate of 41%.
However, since 2000, Hawaii has posted the lowest turnout rate in the region, and from 2000 to 2016, the lowest in the nation. Notably, Hawaii’s turnout rate of 57% in 2020 was its highest in the dataset for the state and a 15-point jump from 2016. It was also the only time a majority of eligible voters in Hawaii cast a ballot from 1980 to 2020.
The West has had the widest gap between the high and low VEPs throughout the dataset. Including the widest gap of 28 points in 2016. The West has 9 out of the ten widest VEP gaps in the series, all of which were over 20 points. This spread is largely driven by Nevada and Hawaii's low turnout rates until 2020.
So, who votes in presidential elections?
The overall national turnout rate from 1980 to 2020 was 59%. In comparison, the Midwest's overall turnout rate was 63%, the Northeast’s was 62%, and the West’s was 59%. The South’s overall rate (w/o DC) was 55%, the only region below the national rate.
At the regional level, the Midwest and Northeast have led the nation in turnout rates. The two regions only posted three elections below majority turnout rates — Indiana ’96, Pennsylvania ’96, and Indiana ’00. That is three elections out of a combined 231. The Midwest and the Northeast also account for 33 of the 43 elections with 70% or greater turnout rates, despite only having a combined 21 states and 38% of the total population. And in 2020, all but two Northeastern states posted turnout rates below 70%. This tight grouping of high-turnout states in the Northeast gave it the lead in regional VEP rates. Historically, a Midwesterner was more likely to vote in a presidential election, followed closely by a resident in the Northeast. However, since 2016, the Northeast has turned out at greater rates.
At the state level, Minnesota boasts the three highest turnout rates and half of the top ten turnout rates in the data series. It was the only state to reach the 80% threshold during this period. Minnesota also has 8 of the 43 elections with greater than 70% turnout. Minnesota has never had a turnout rate below the national average; in fact, its lowest turnout rate in 1996 was just seven thousandths below the high national average watermark of 67% (2020). In other words, Minnesota was less than one point shy of all its presidential turnout rates being above any high point in the national average in the dataset.
Conversely, South Carolina and Hawaii had some of the lowest turnout rates in the nation. From 1980 to 2000, less than half of eligible South Carolinians voted for the presidency. And in every presidential election, South Carolina and Hawaii trailed the national mean. Only one of Hawaii’s eleven elections was above 50% turnout (2020). Hawaii accounts for almost half the West’s 22 elections below majority turnout in the series (10). The South had 41 elections below majority VEP, nearly double the West's. South Carolina and Georgia each account for six elections below majority turnout in the South (12 total). The rest are spread fairly evenly throughout the region. Overall, the Southern states voted at lower rates at a higher frequency, and at the state level, Hawaiians voted at low rates the most often. However, since the national low point in 1996, nearly every state in the Union's turnout rates have trended up.