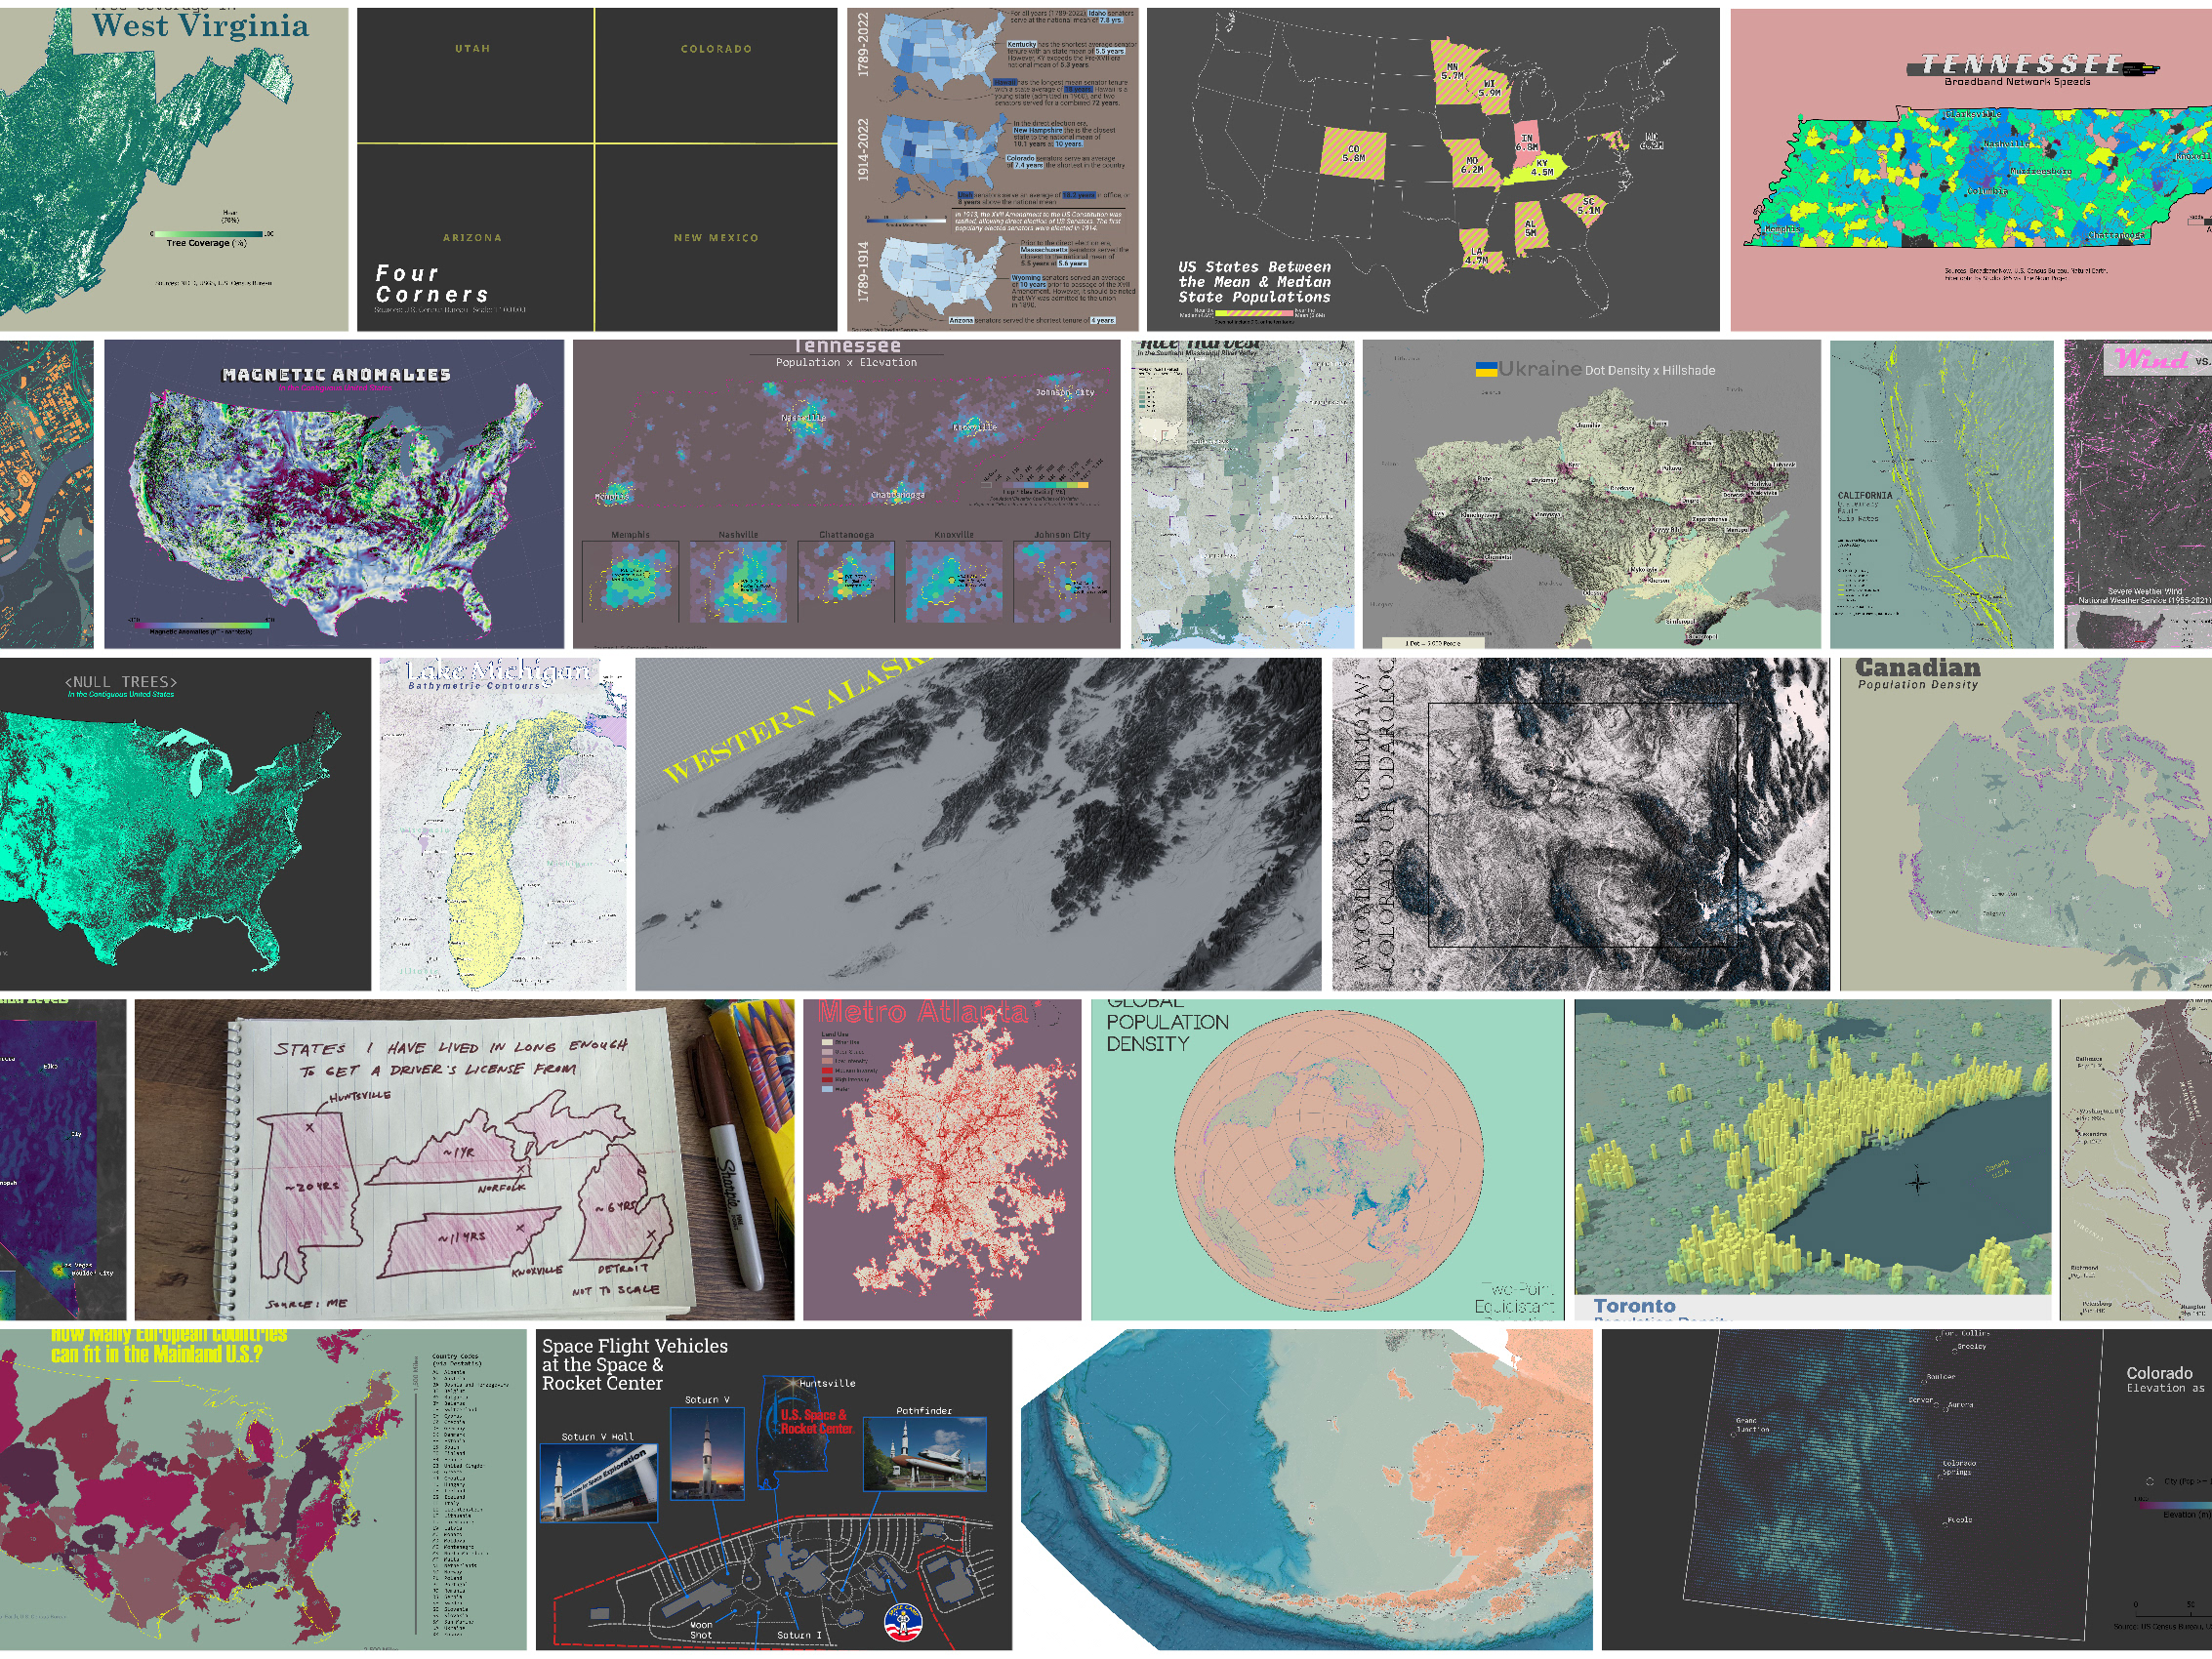
#MapPromptMonday is a weekly social mapping project where prompts are issued for the week, and mappers post their maps based on the prompts.
Prompts
Week 1 - Regions
Midwest Population Density from 1790 to 2020
This map started out life in RStudio. My initial plan was to make a small multiples map of all the regions with state-level population data. I completed a draft version of the Midwest and I felt the map needed a bit more to it, so I added in county-level data. R was not happy with a single year of county-level Census data so I migrated the project over the ArcGIS Pro.
Since we have been working with over 50k rows of data for 24 decades it made sense to use Python to automate as much of my workflow as possible. The final maps were exported as PNGs and converted into an animated GIF in Photoshop.
Tools: ArcGIS Pro, ArcPy, Adobe Photoshop
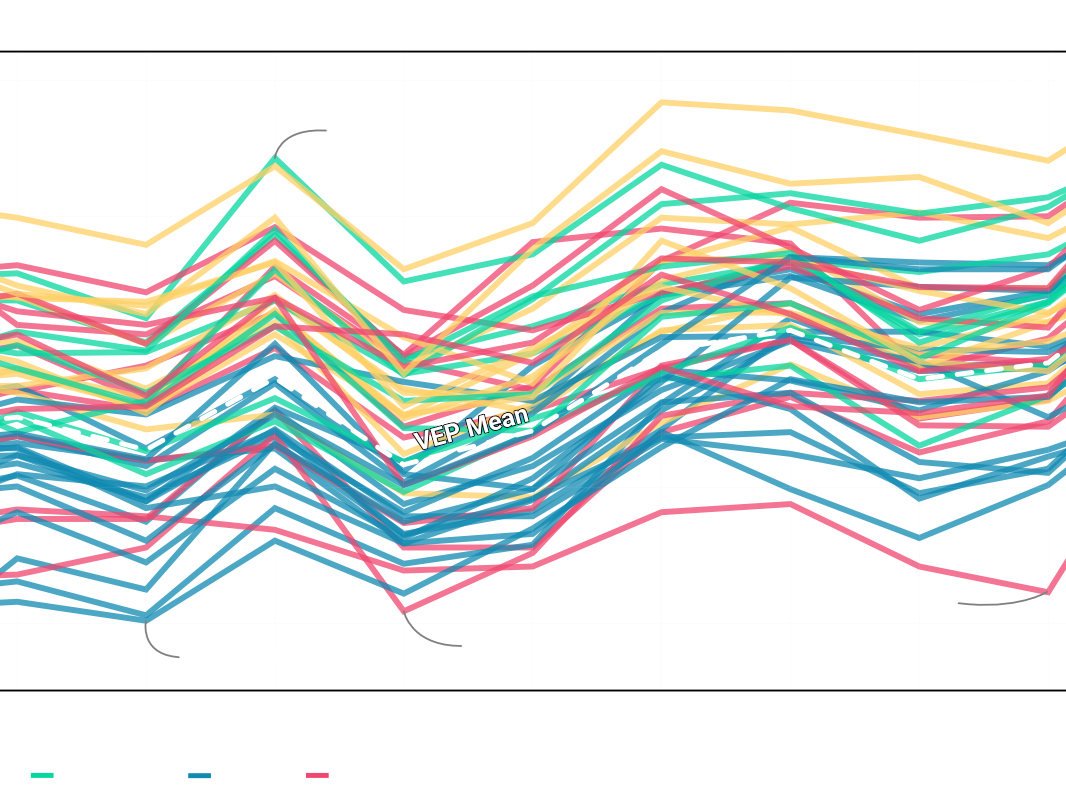
Week 2 - Heat Map
Voter Turnout Relative to the National Mean (1980-2020)
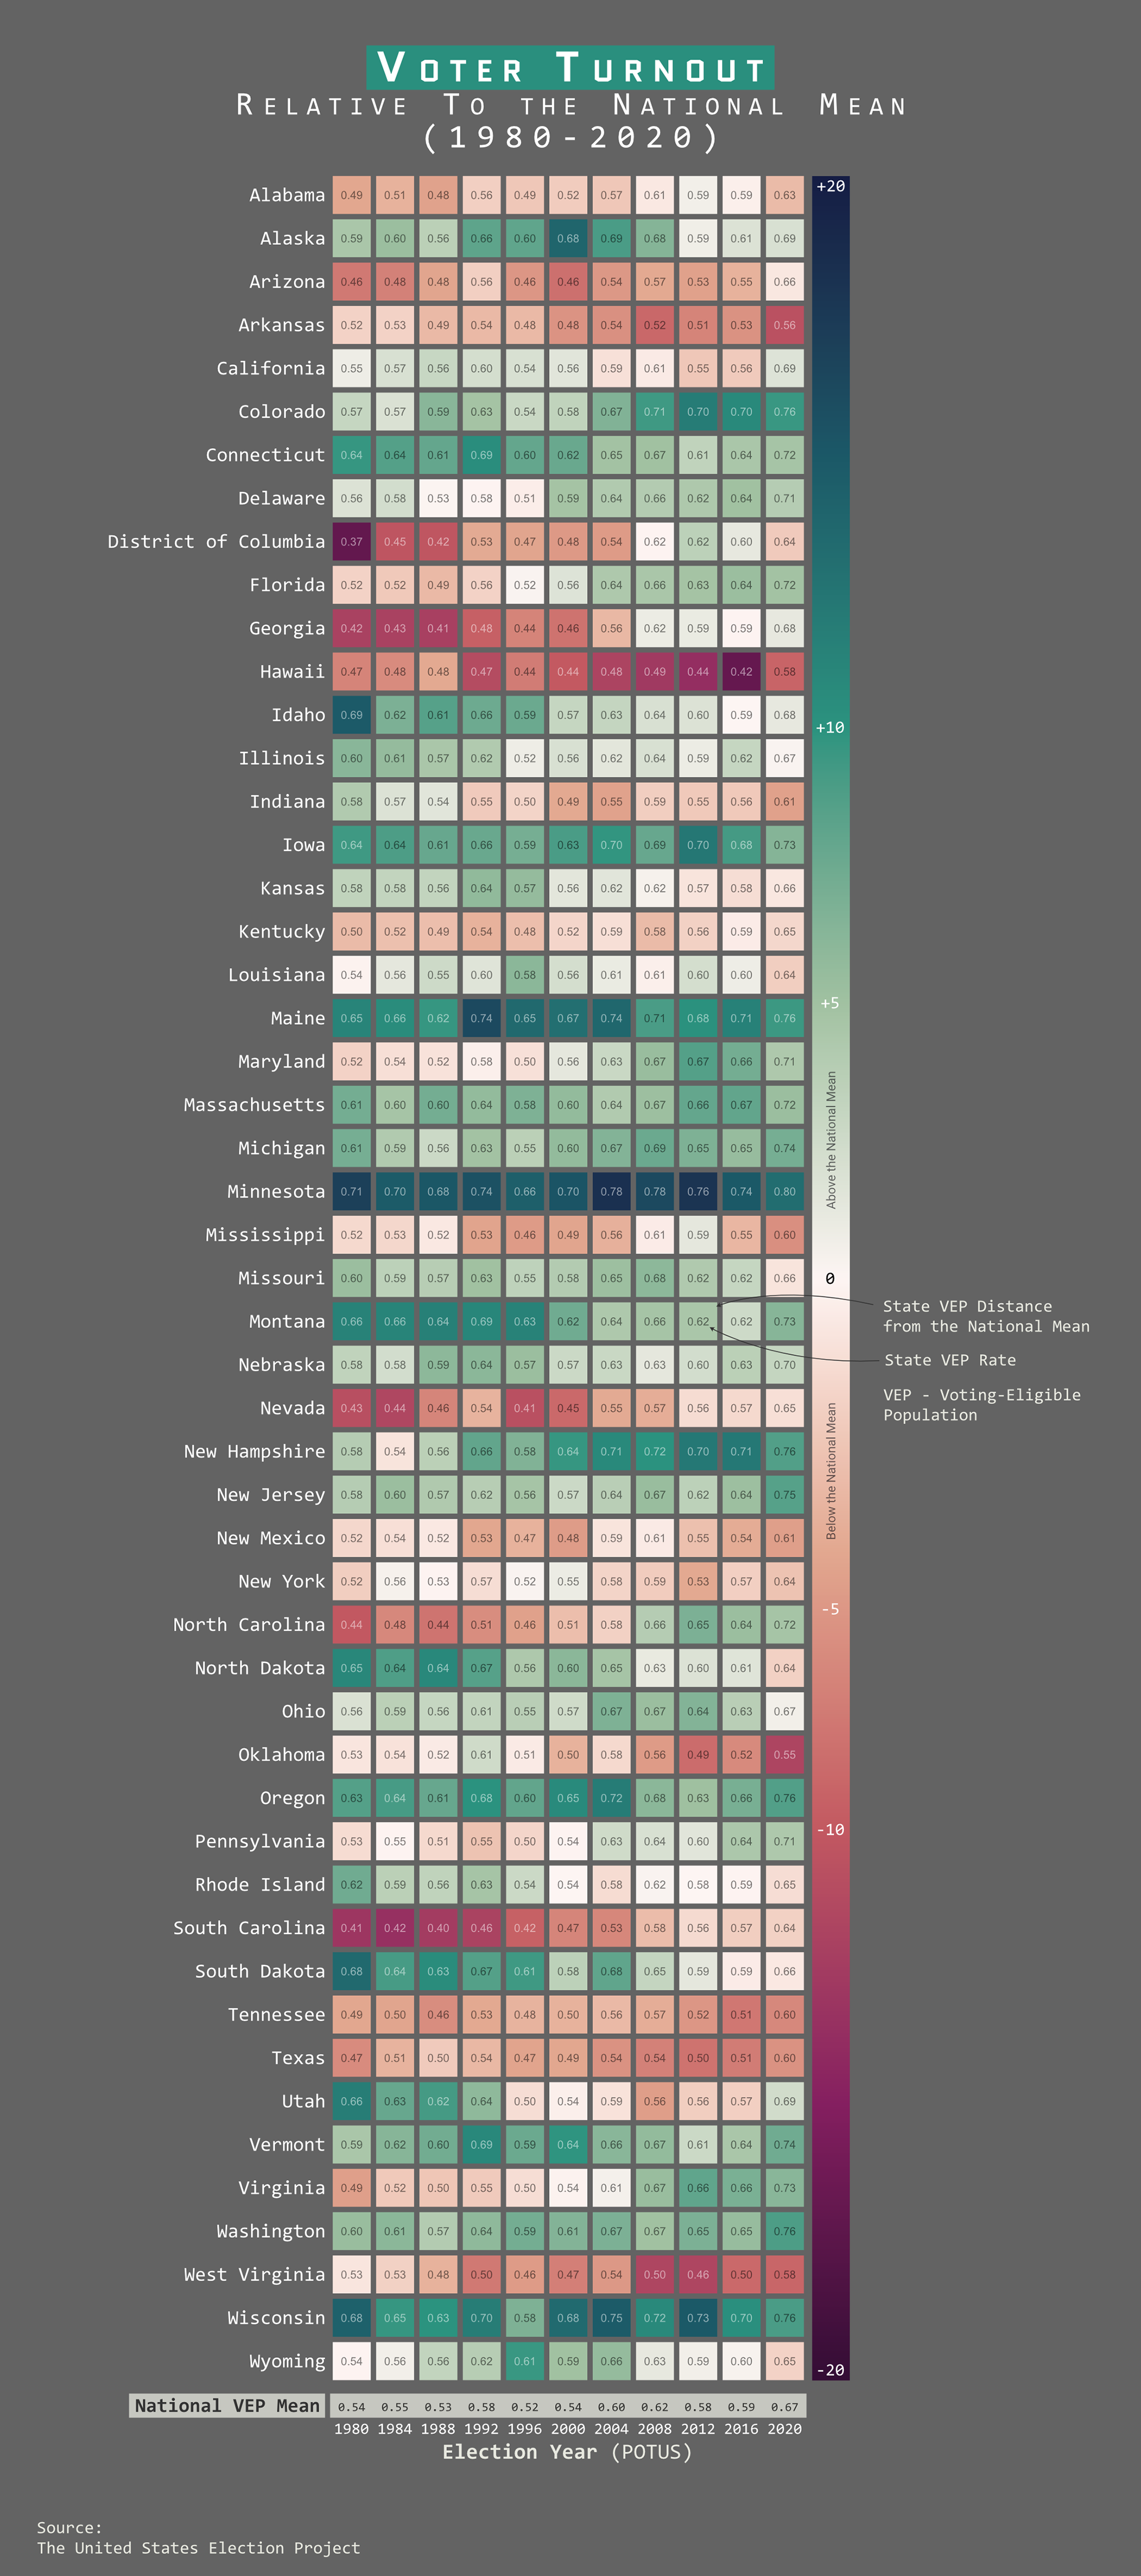
VEP By Regions
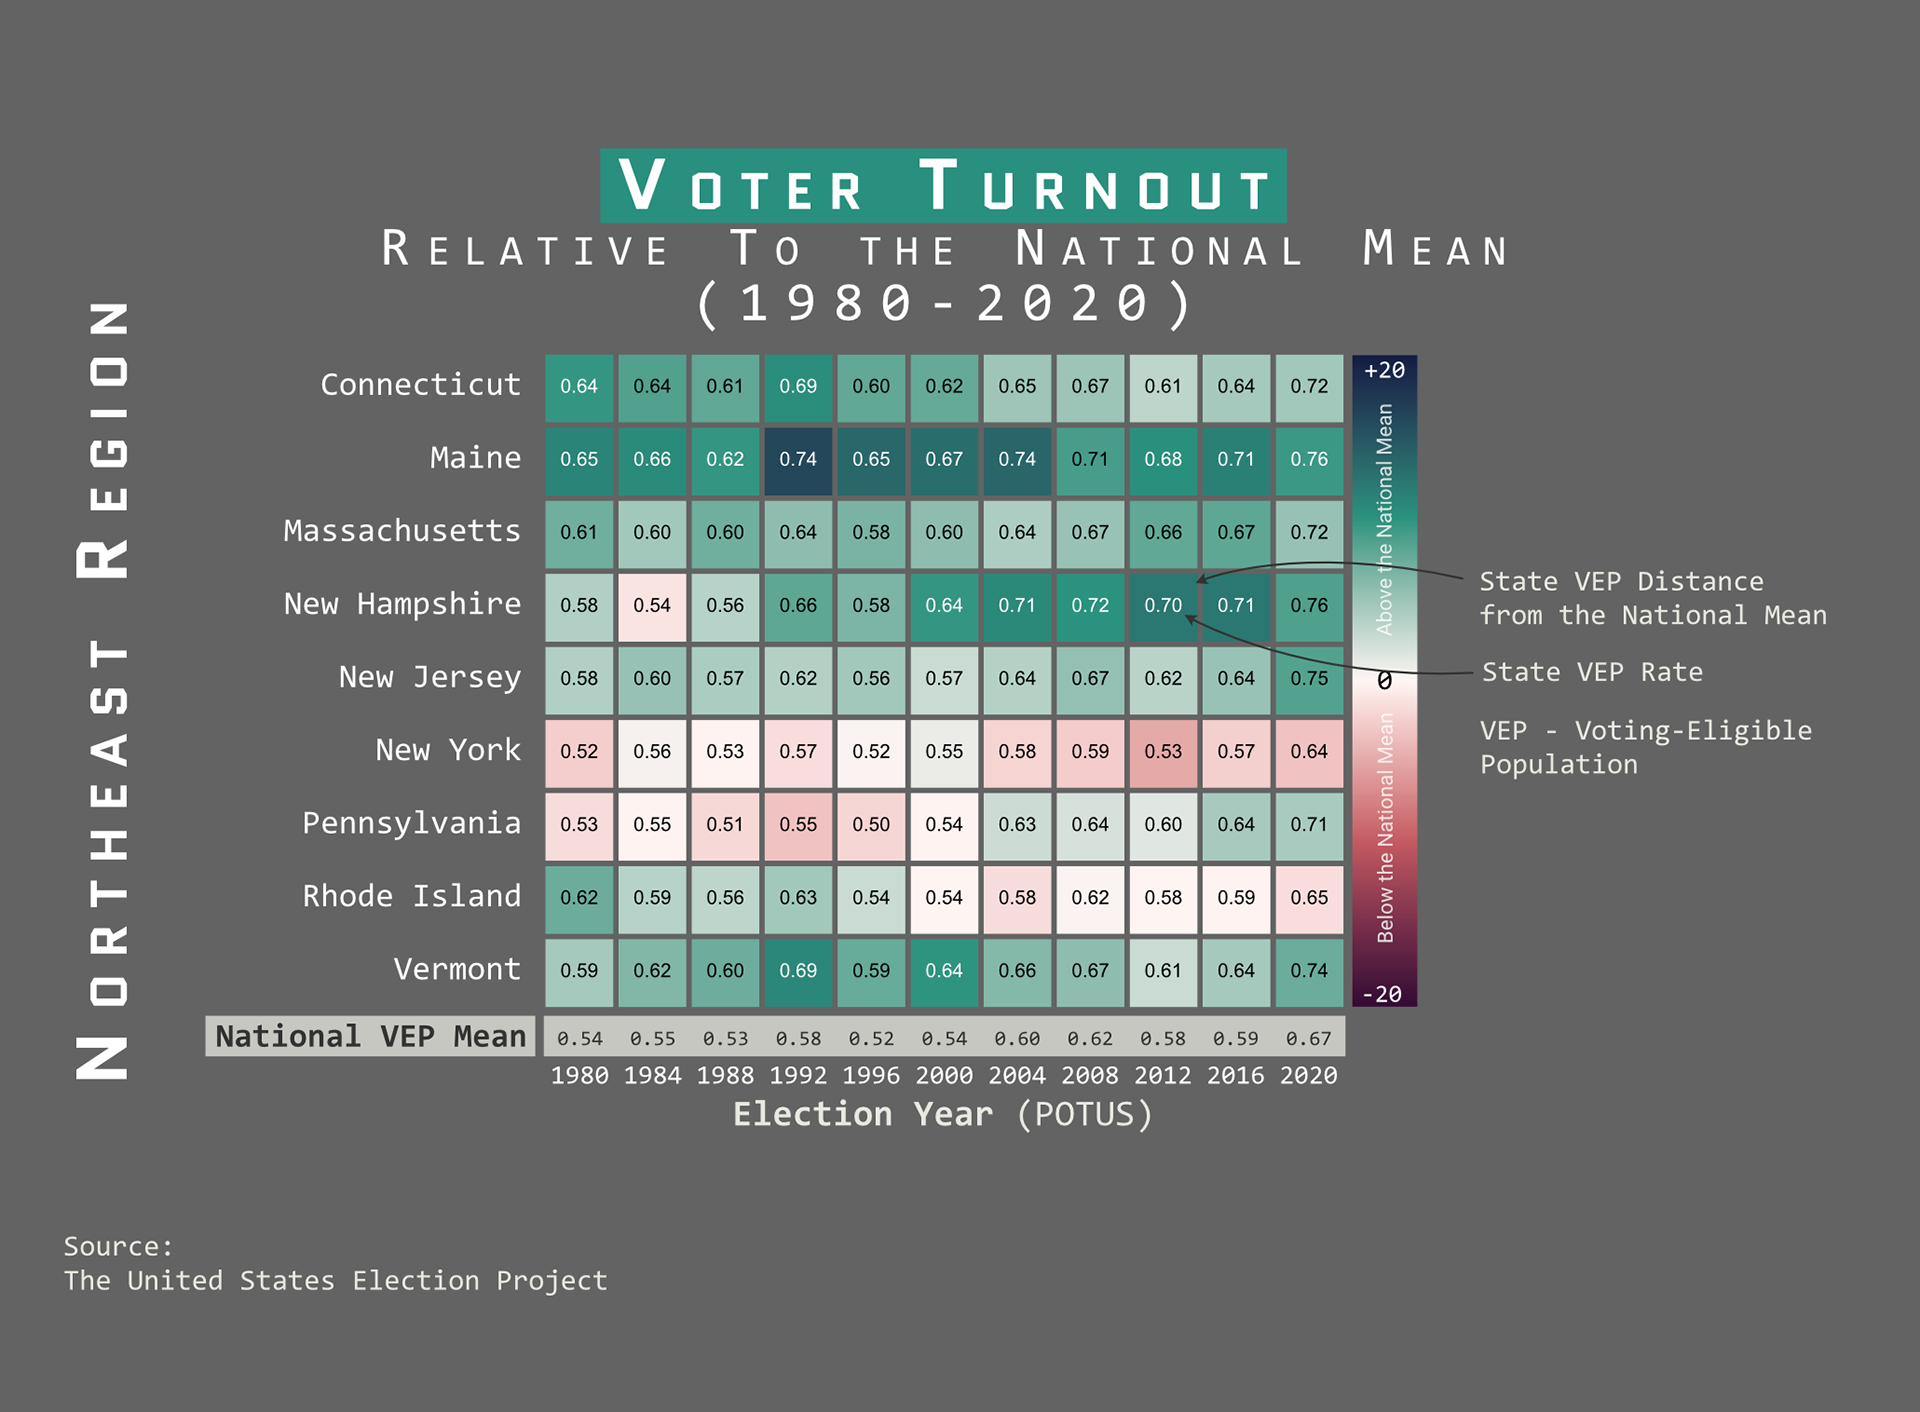
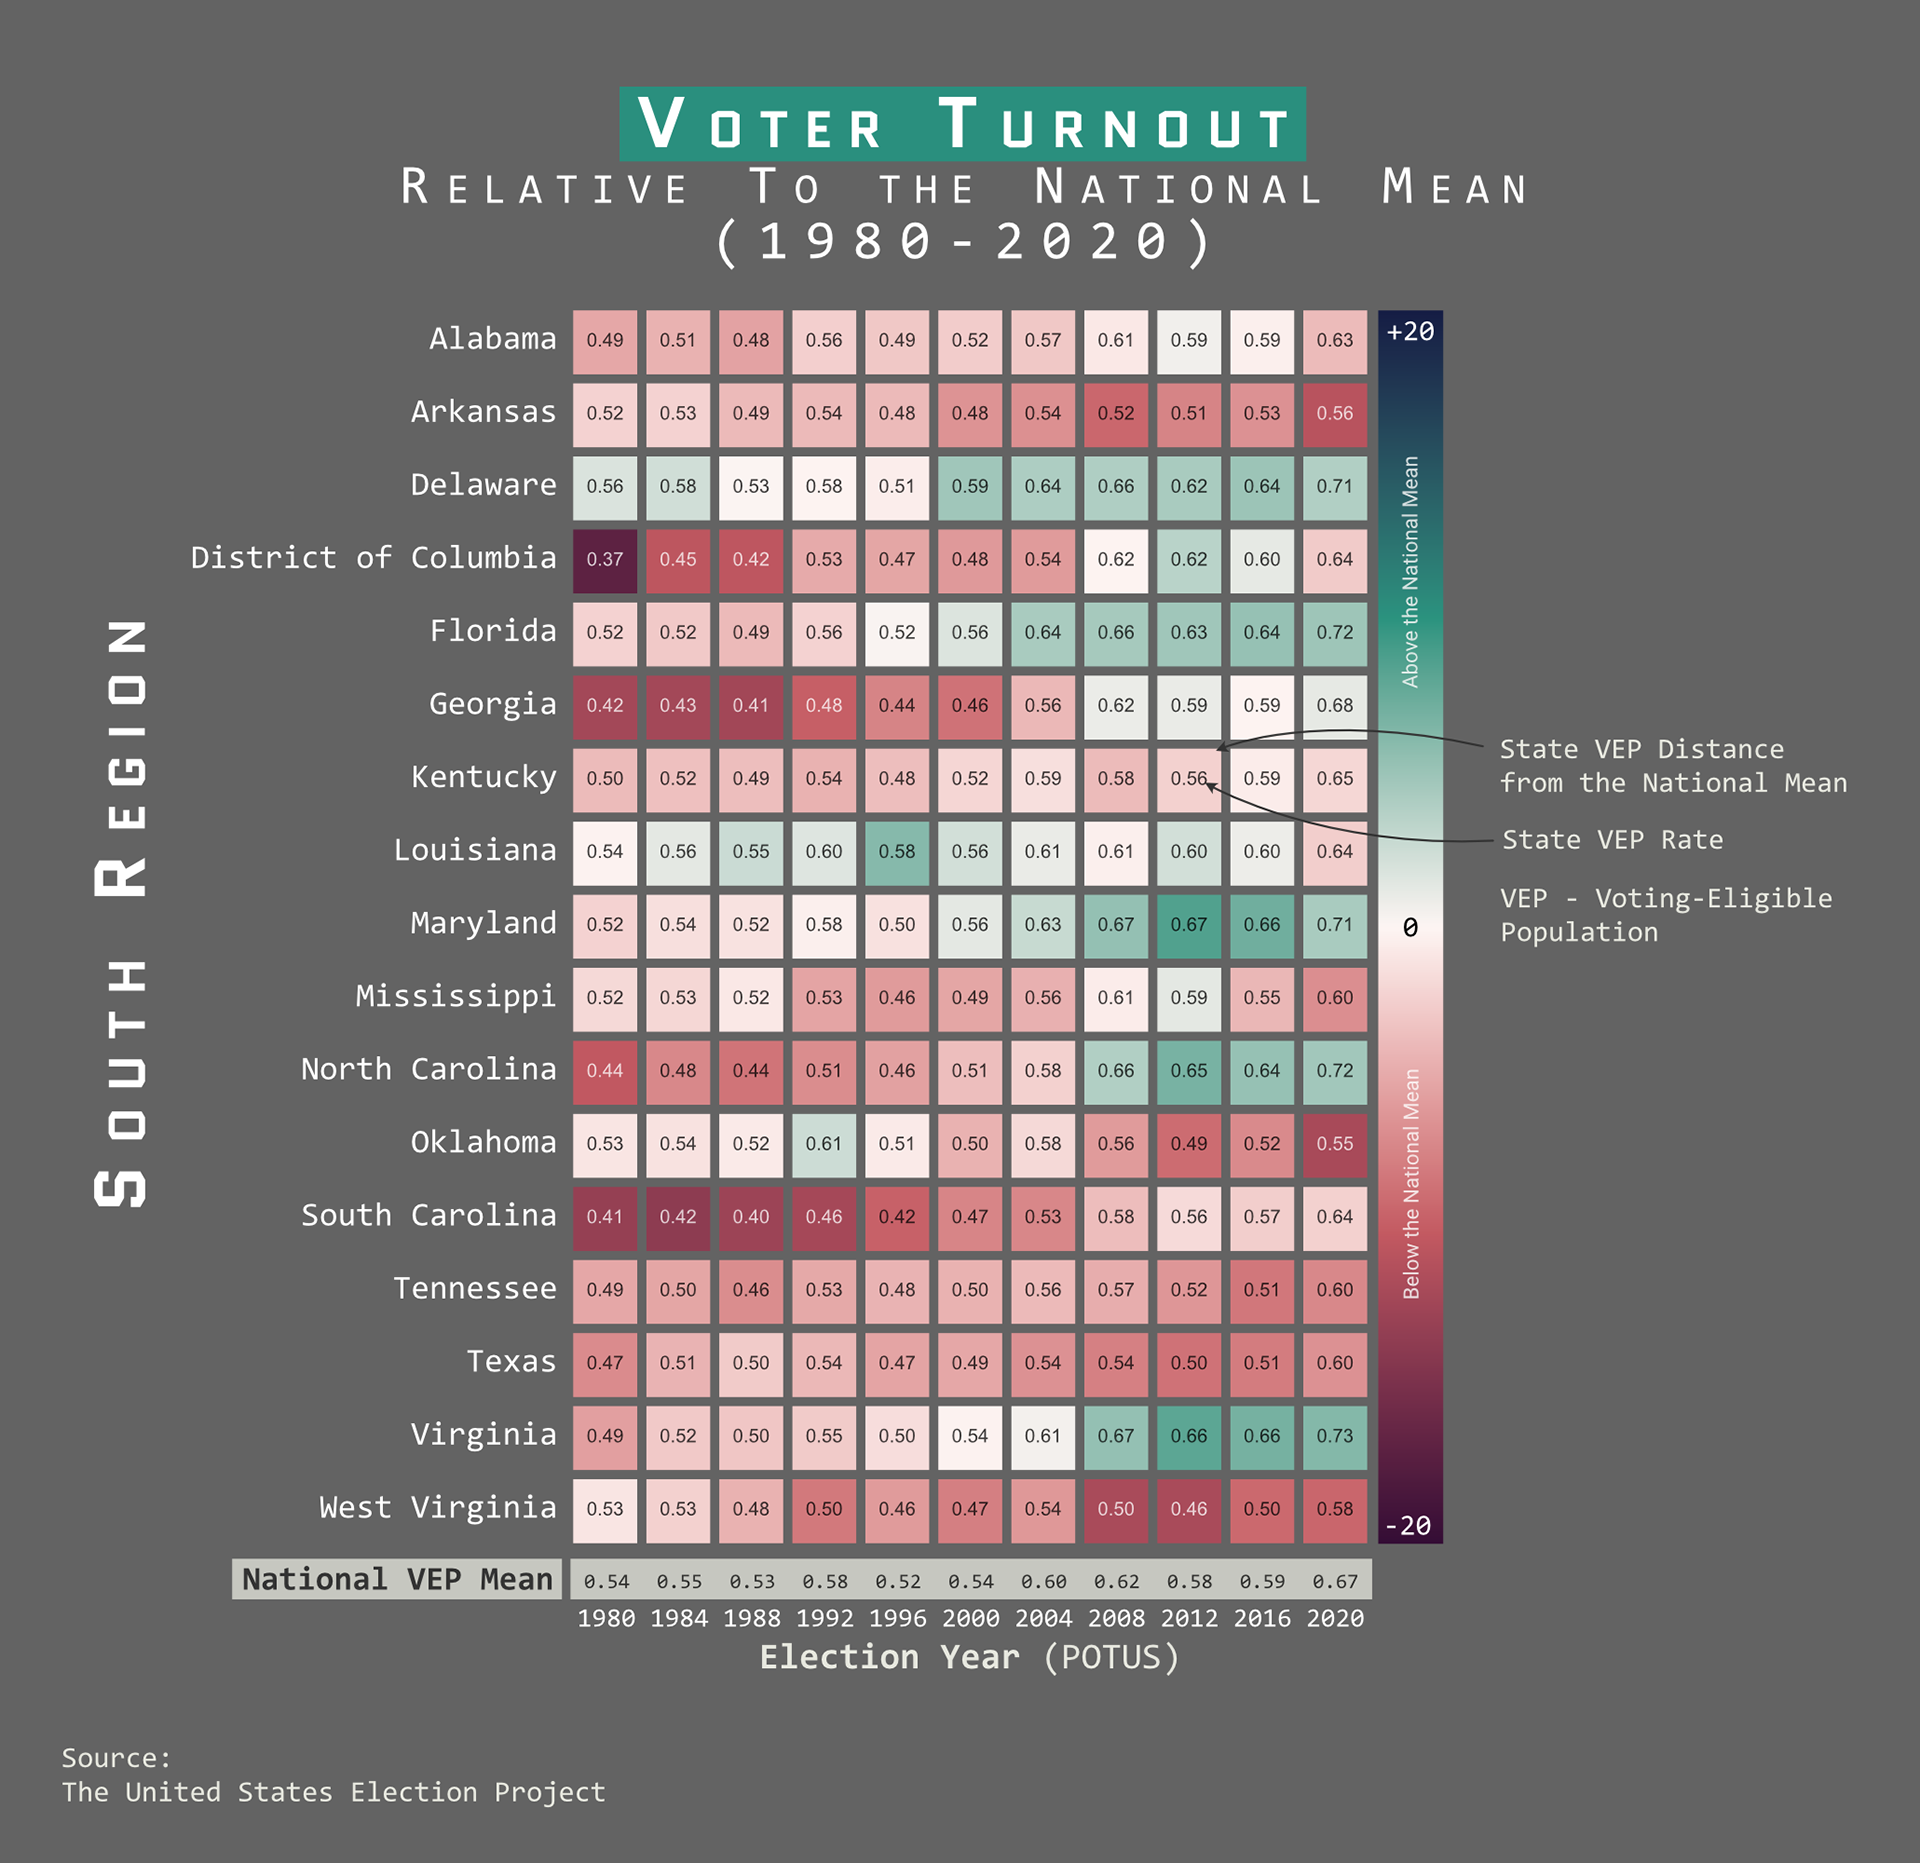
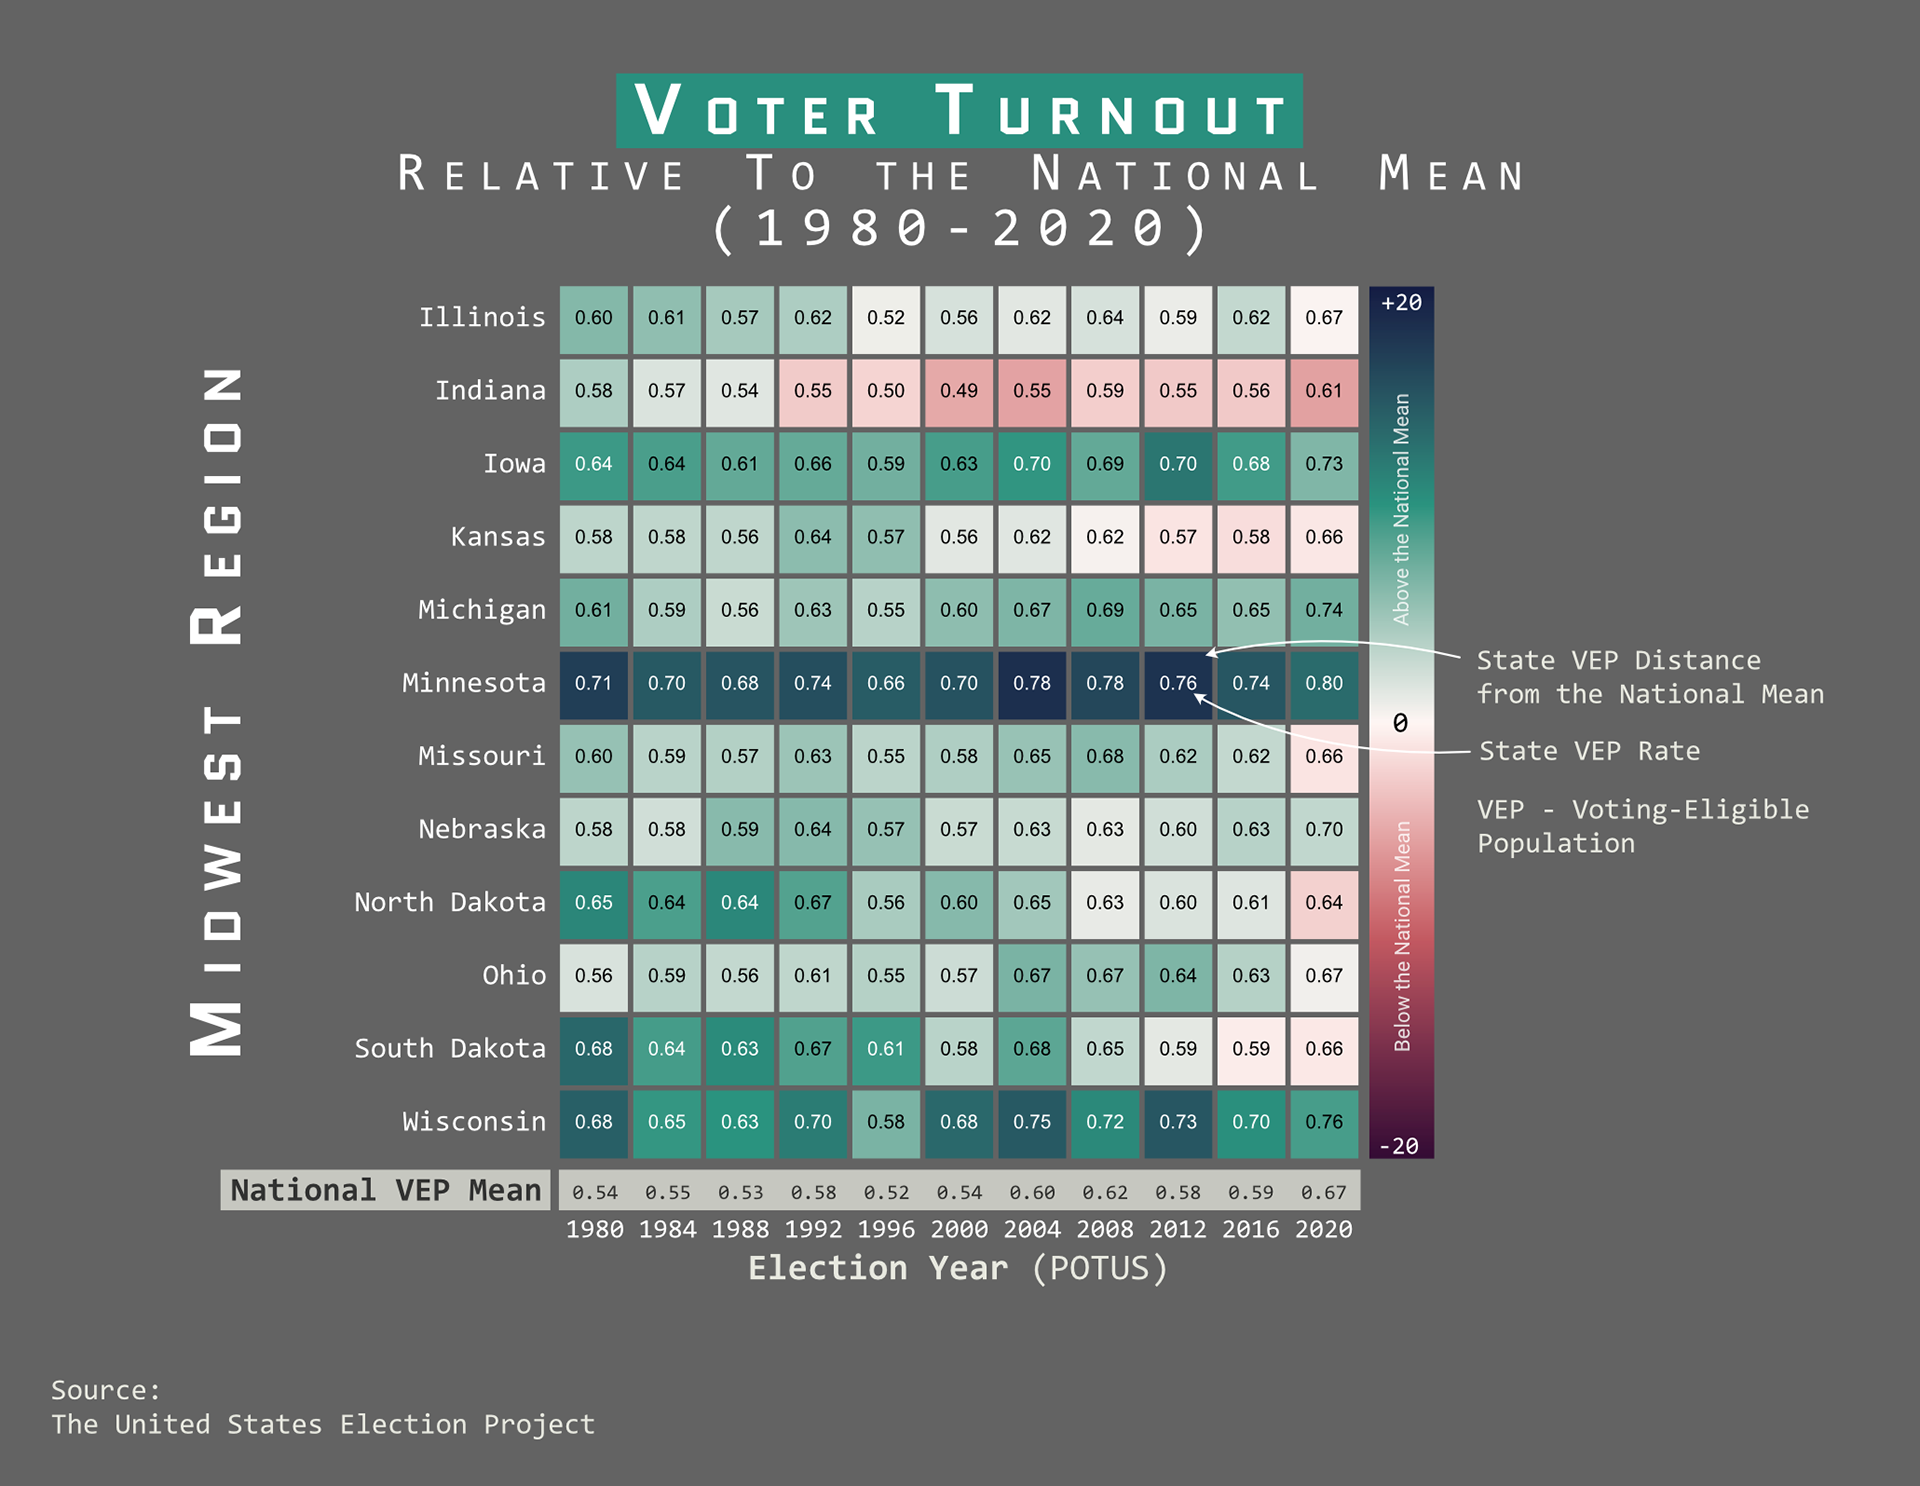
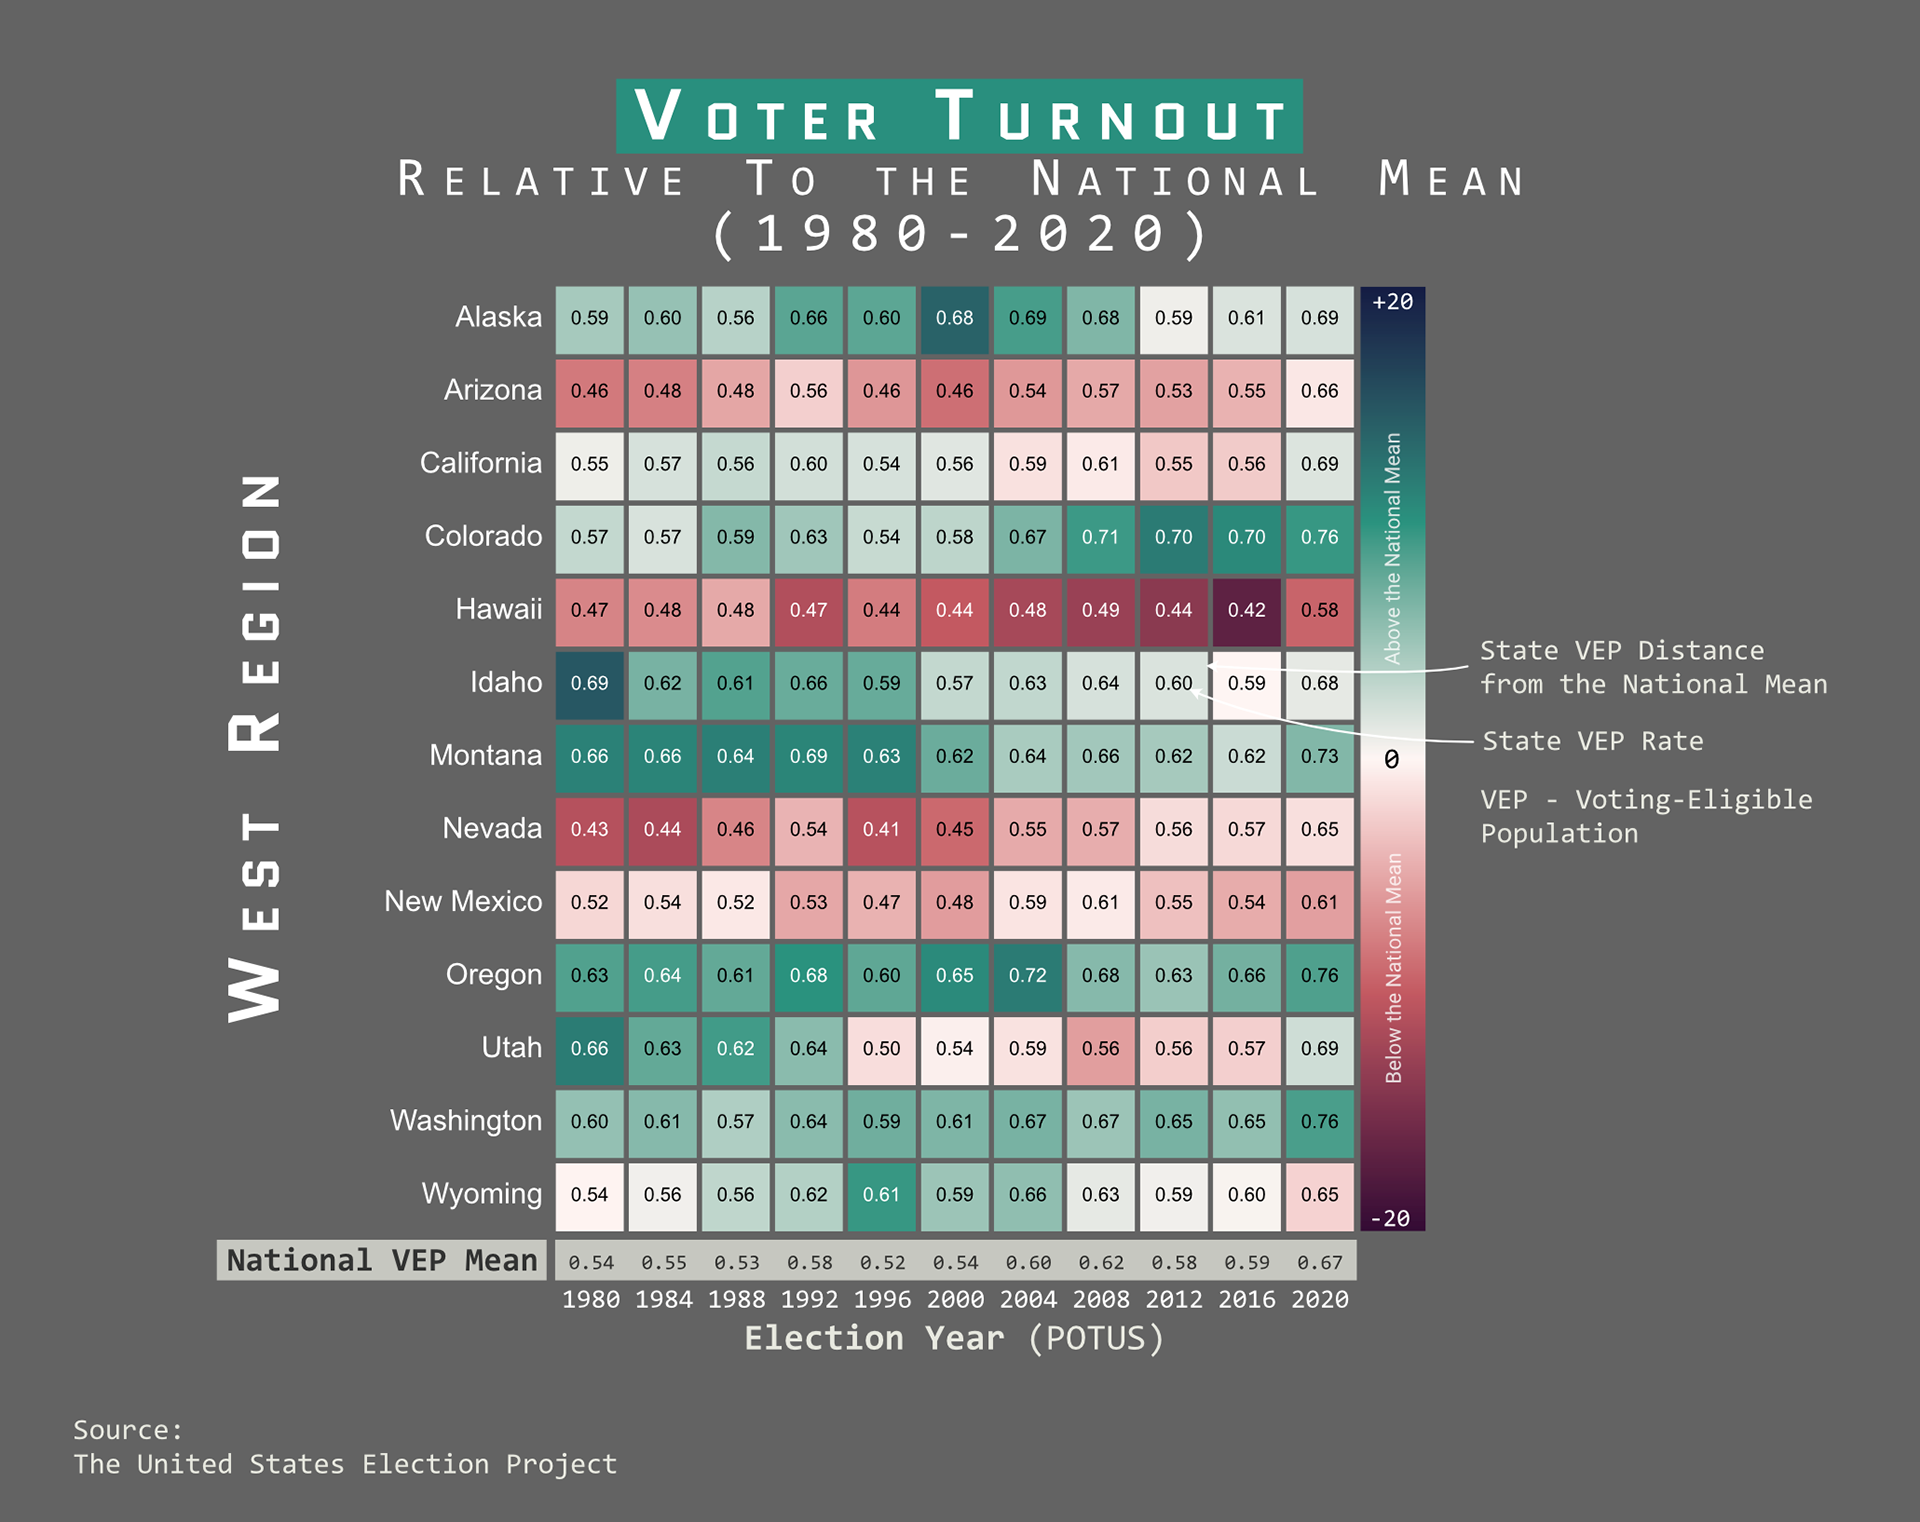
Tools: R (ggplot) and Affinity Designer
Week 3 -Color-Blind Friendly
Housing Vacancy Rates in the Contiguous United States (2022)
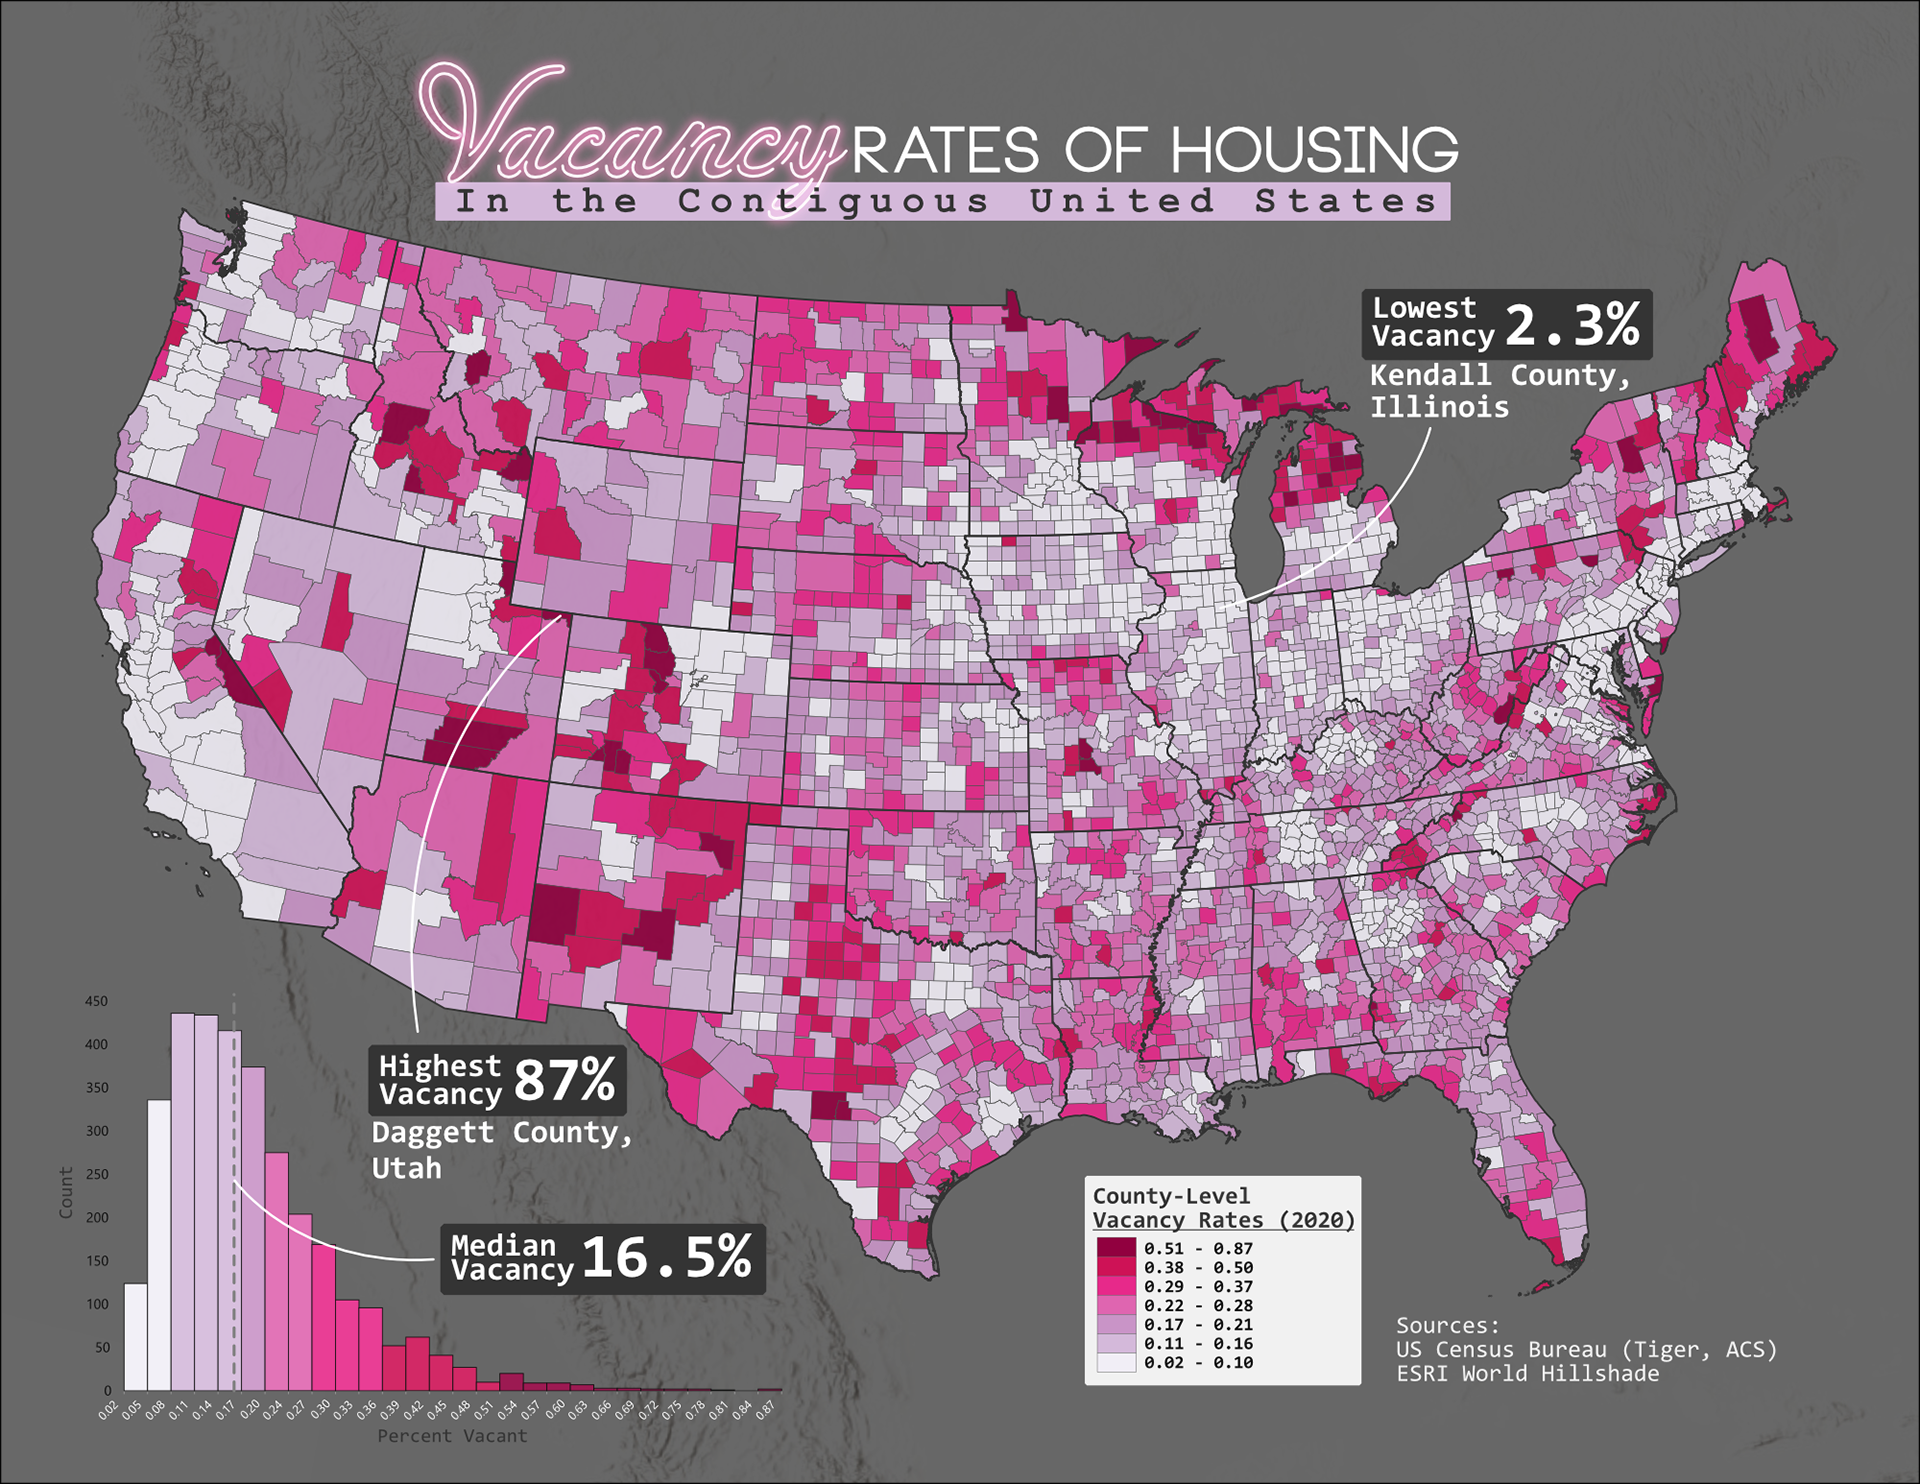
Tools: ArcGIS Pro, Affinity Designer
Week 4 - Film/TV
Settings of TV Shows I watched in the 90s
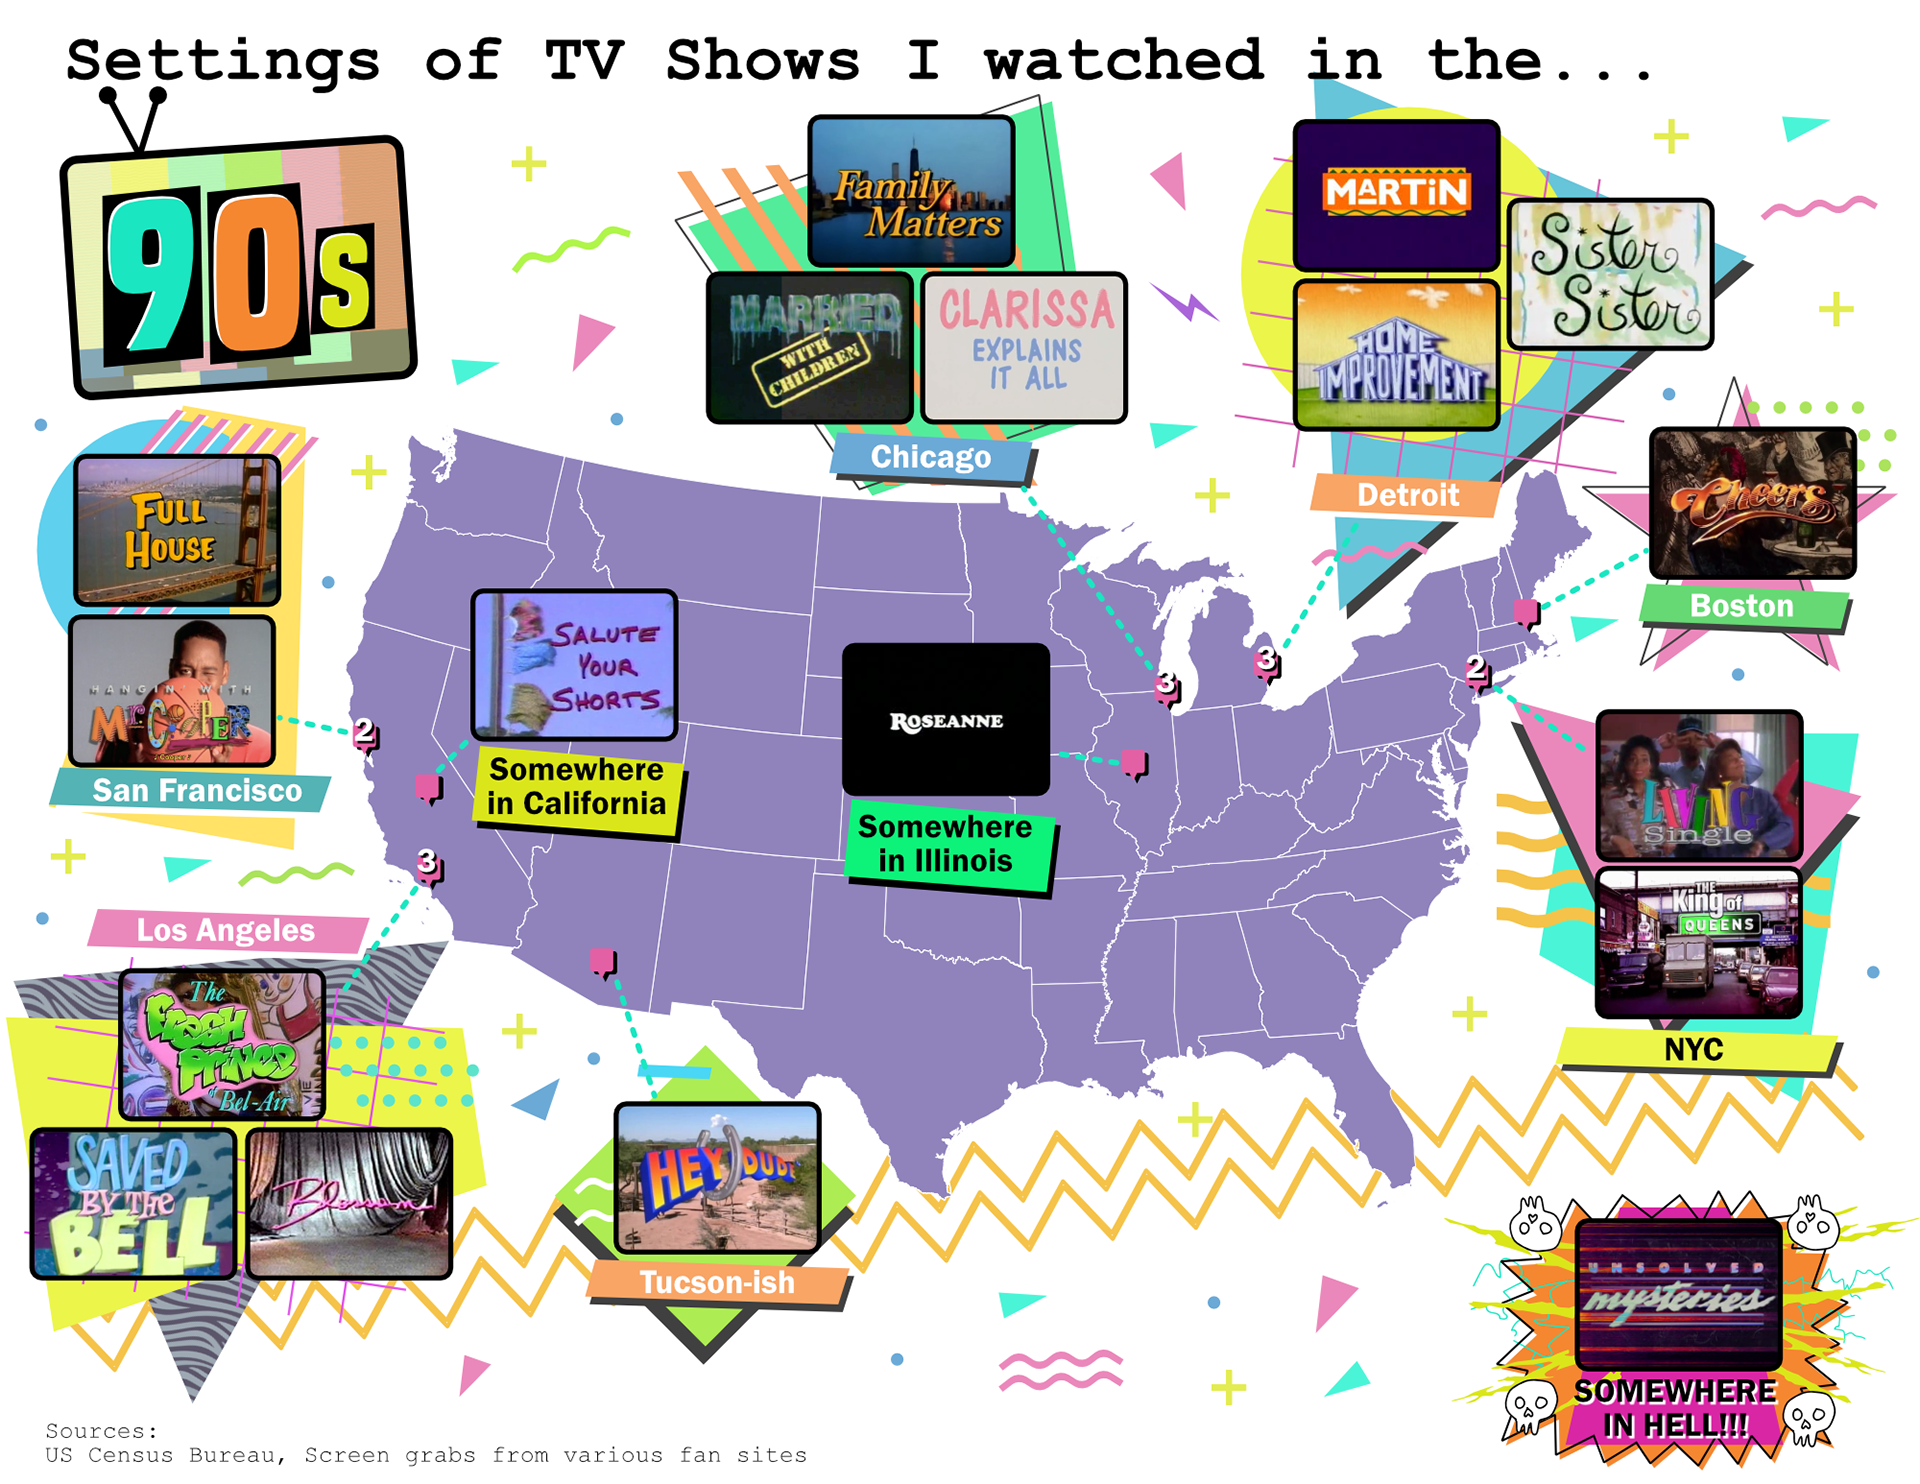
Tools: ArcGIS Pro, Affinity Designer
Week 5 - Flow Map
Surface Wind Flow from the December 2022 Winter Storm
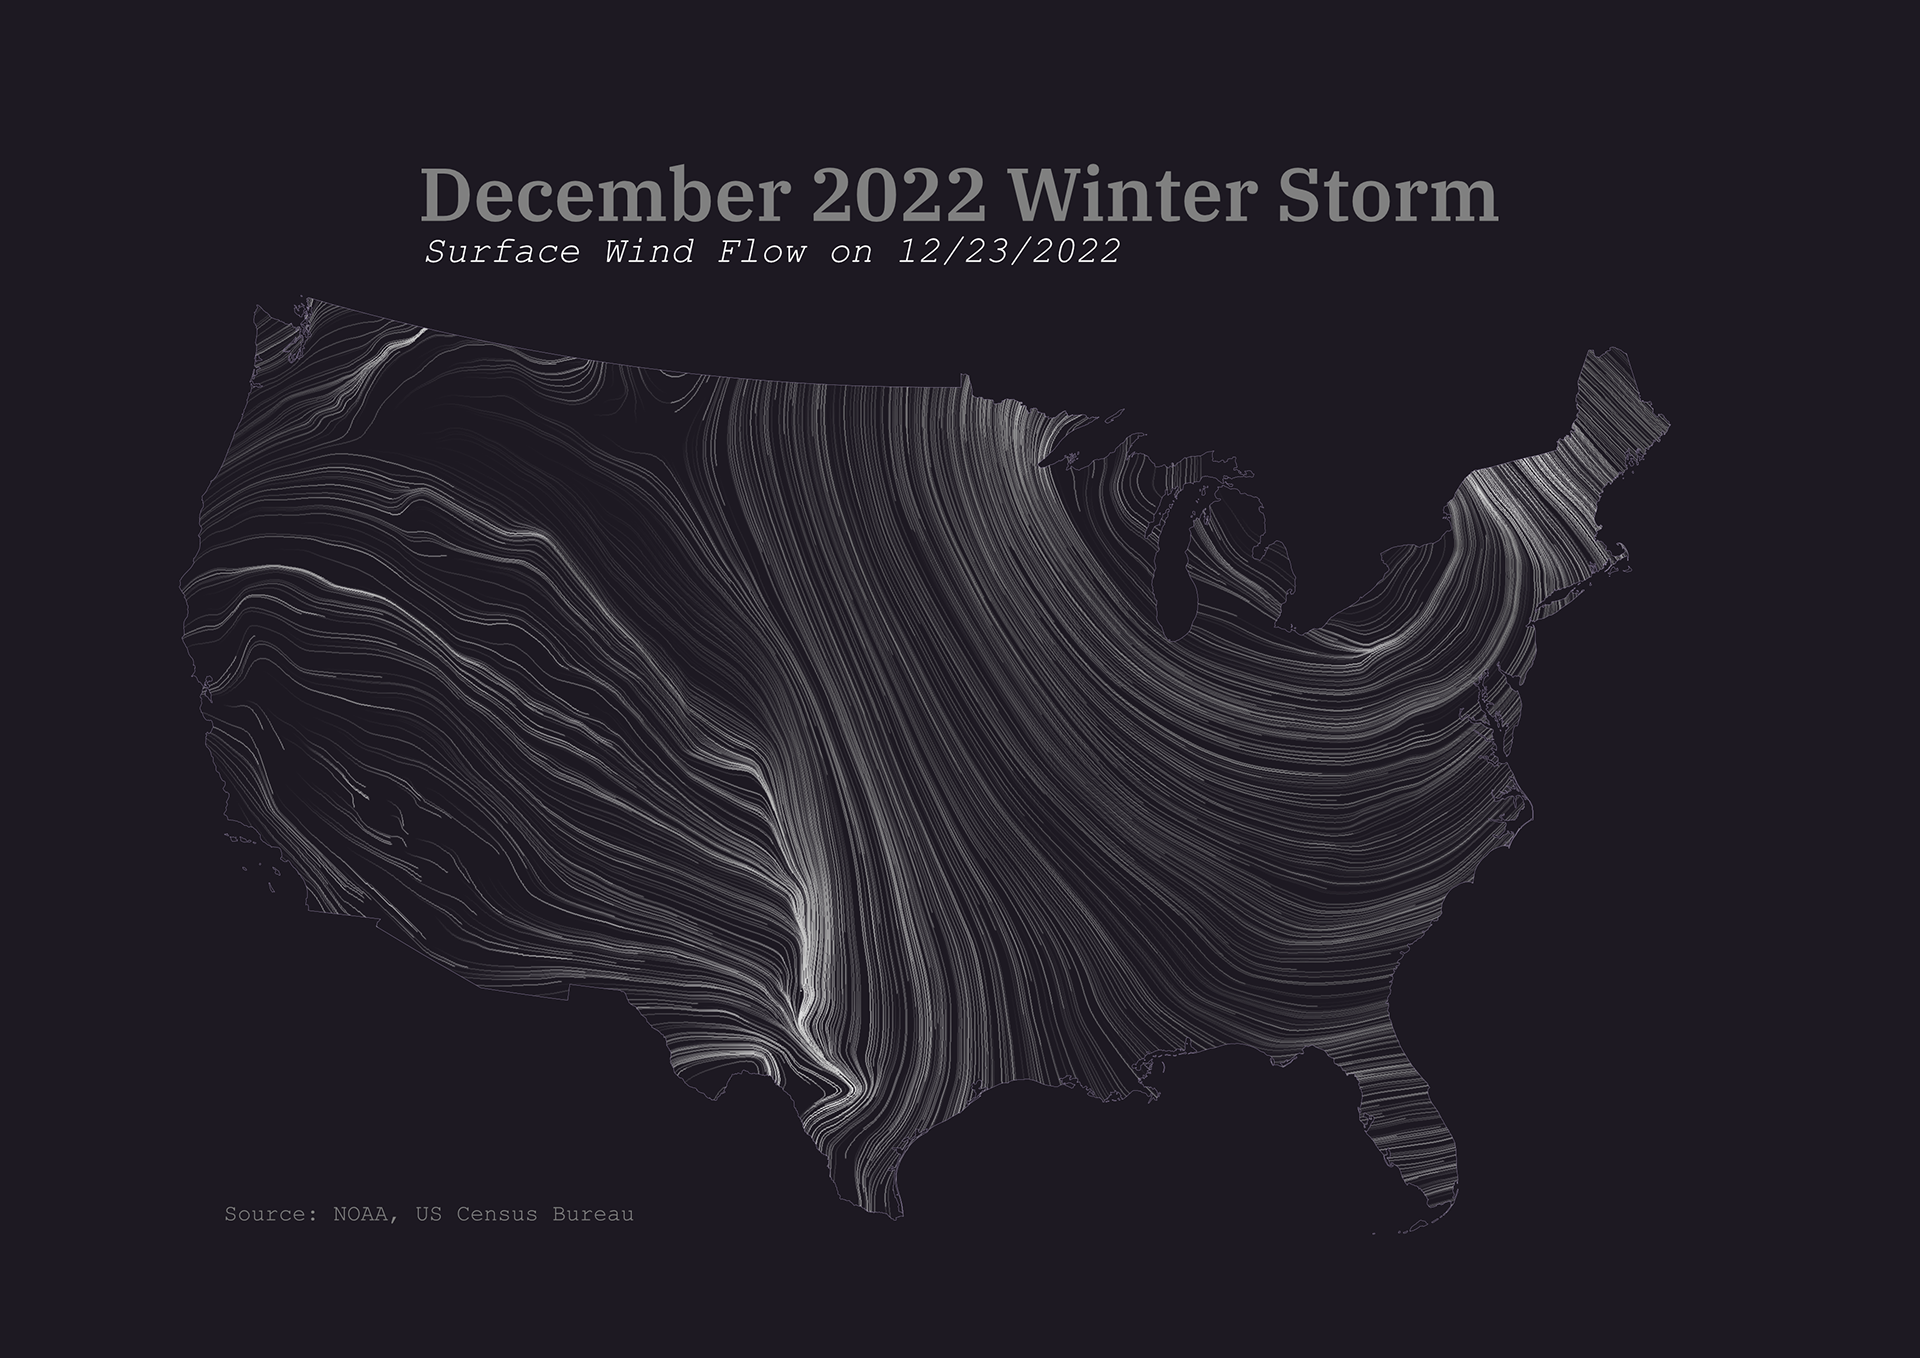
Tools: QGIS & Affinity Designer
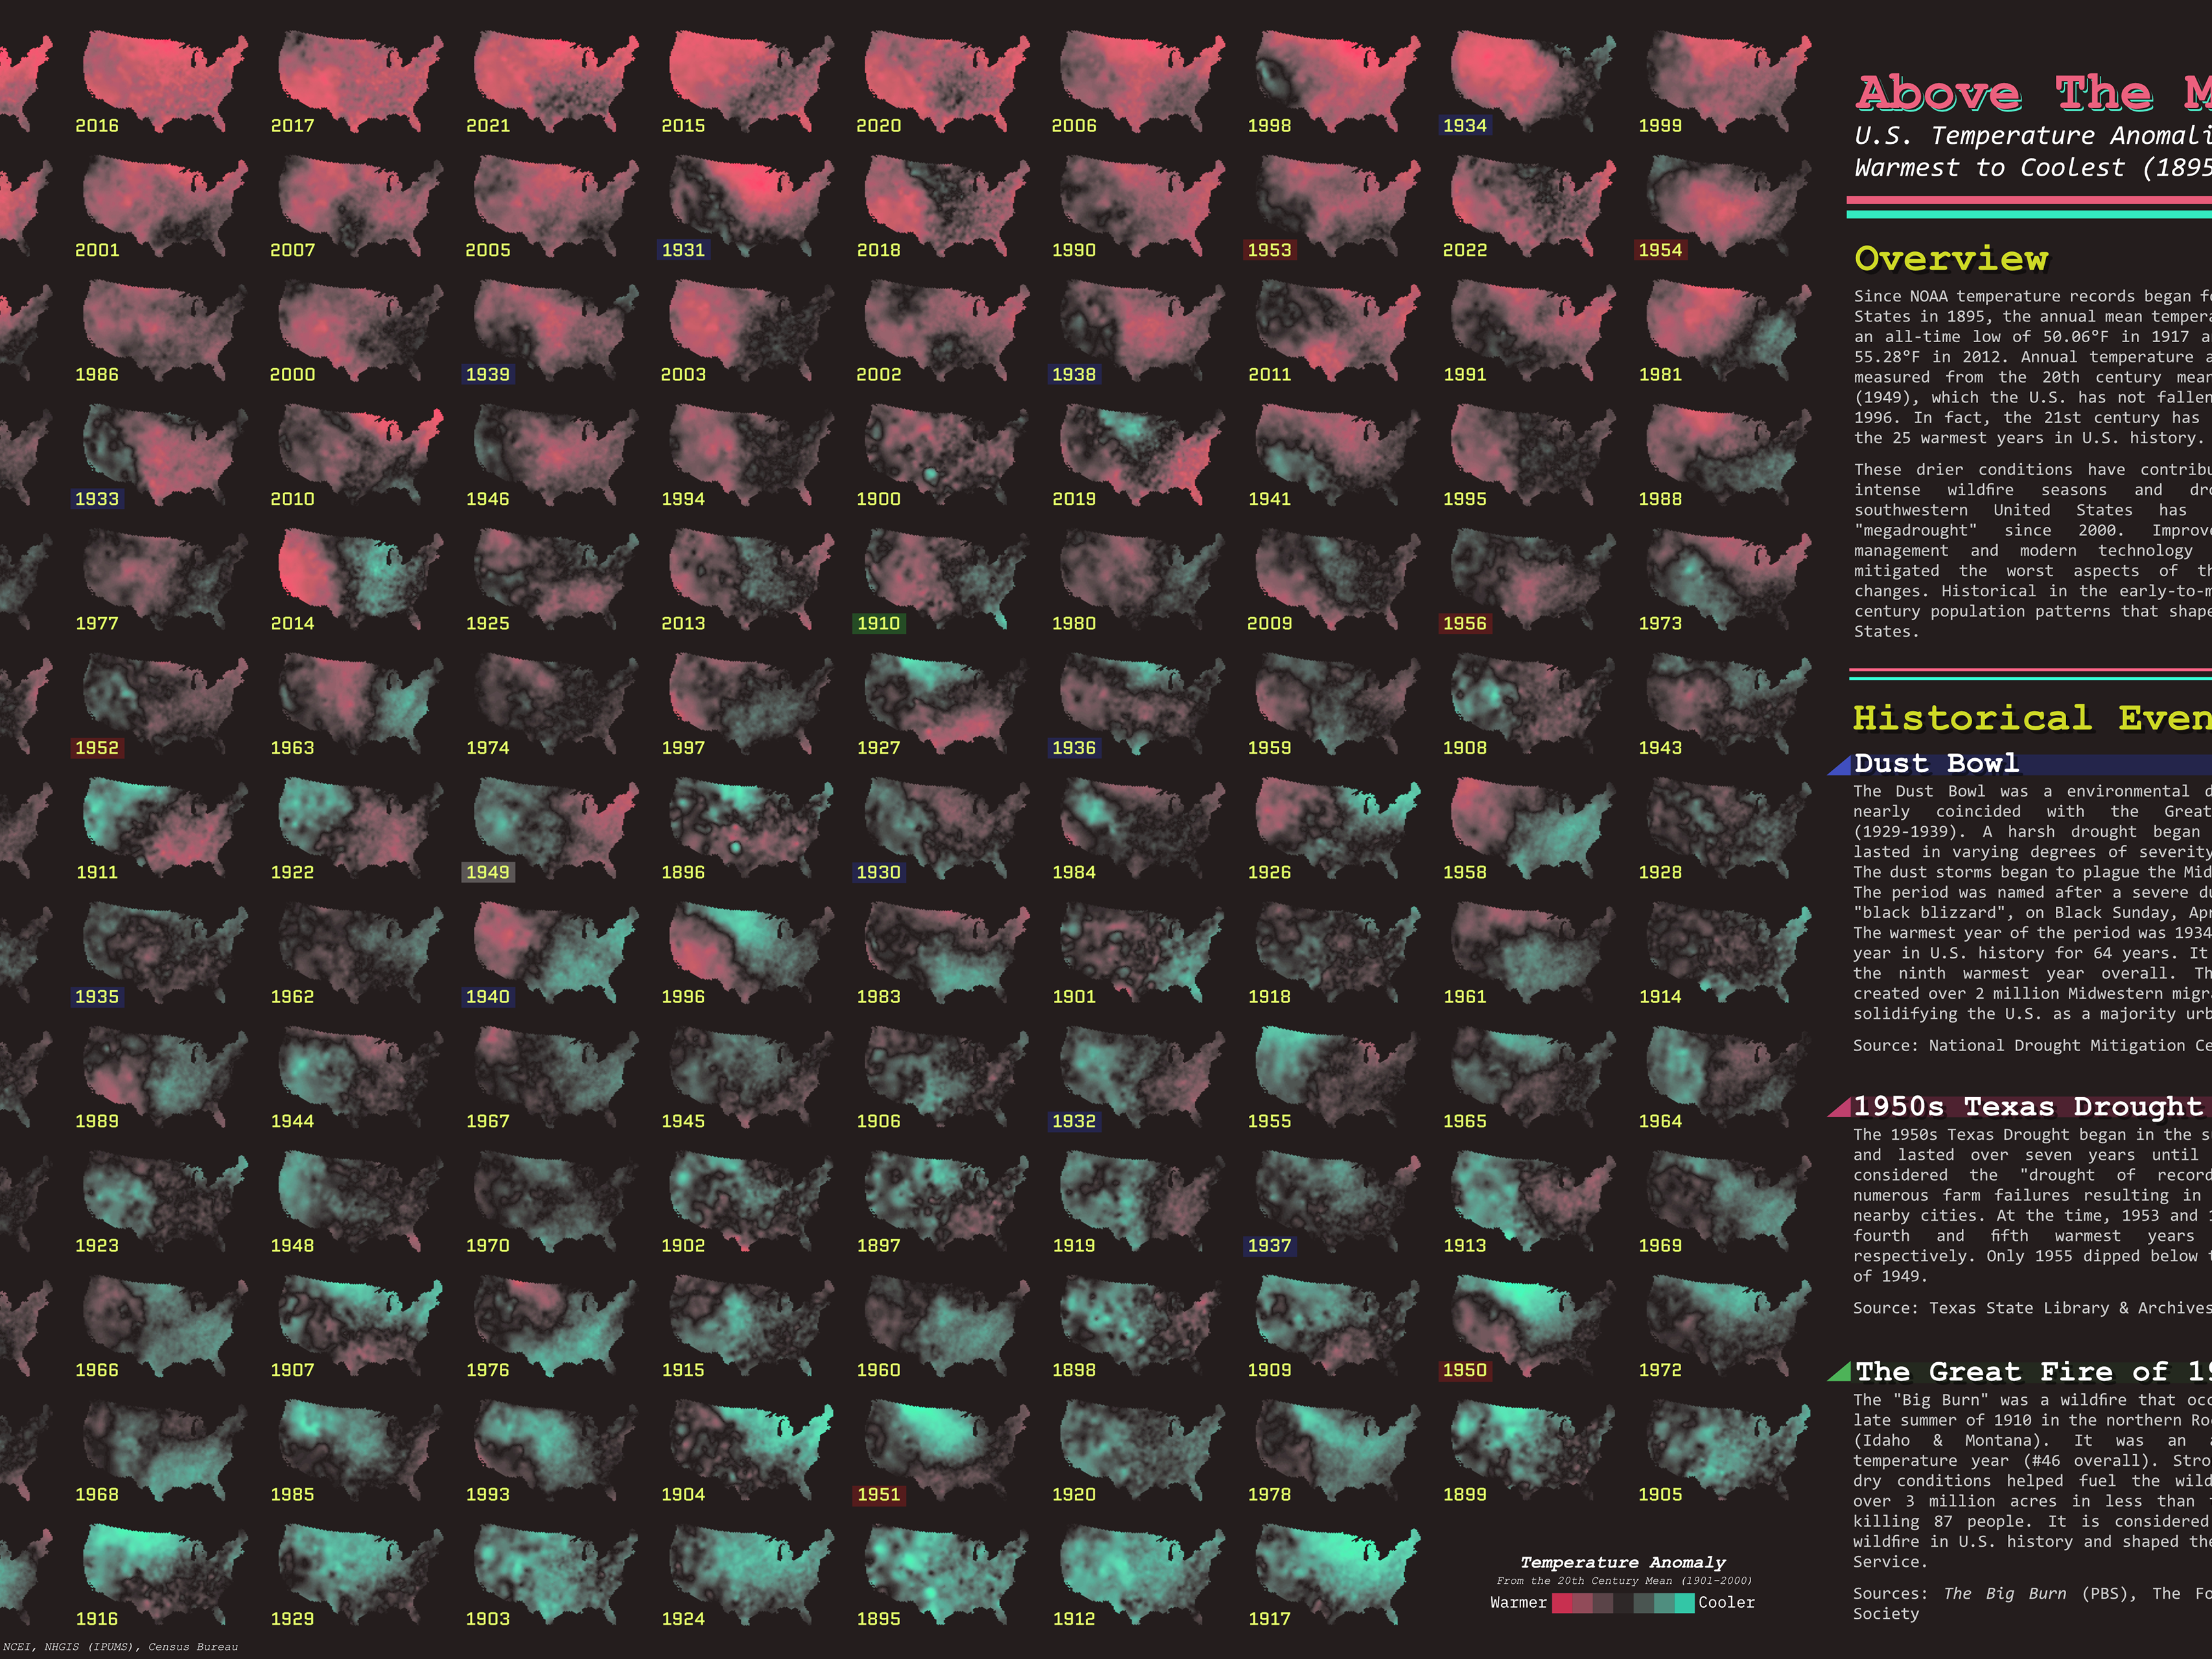
Week 7 - Bivariate Map
2010-2020 Climate Anomalies in the Contiguous U.S.
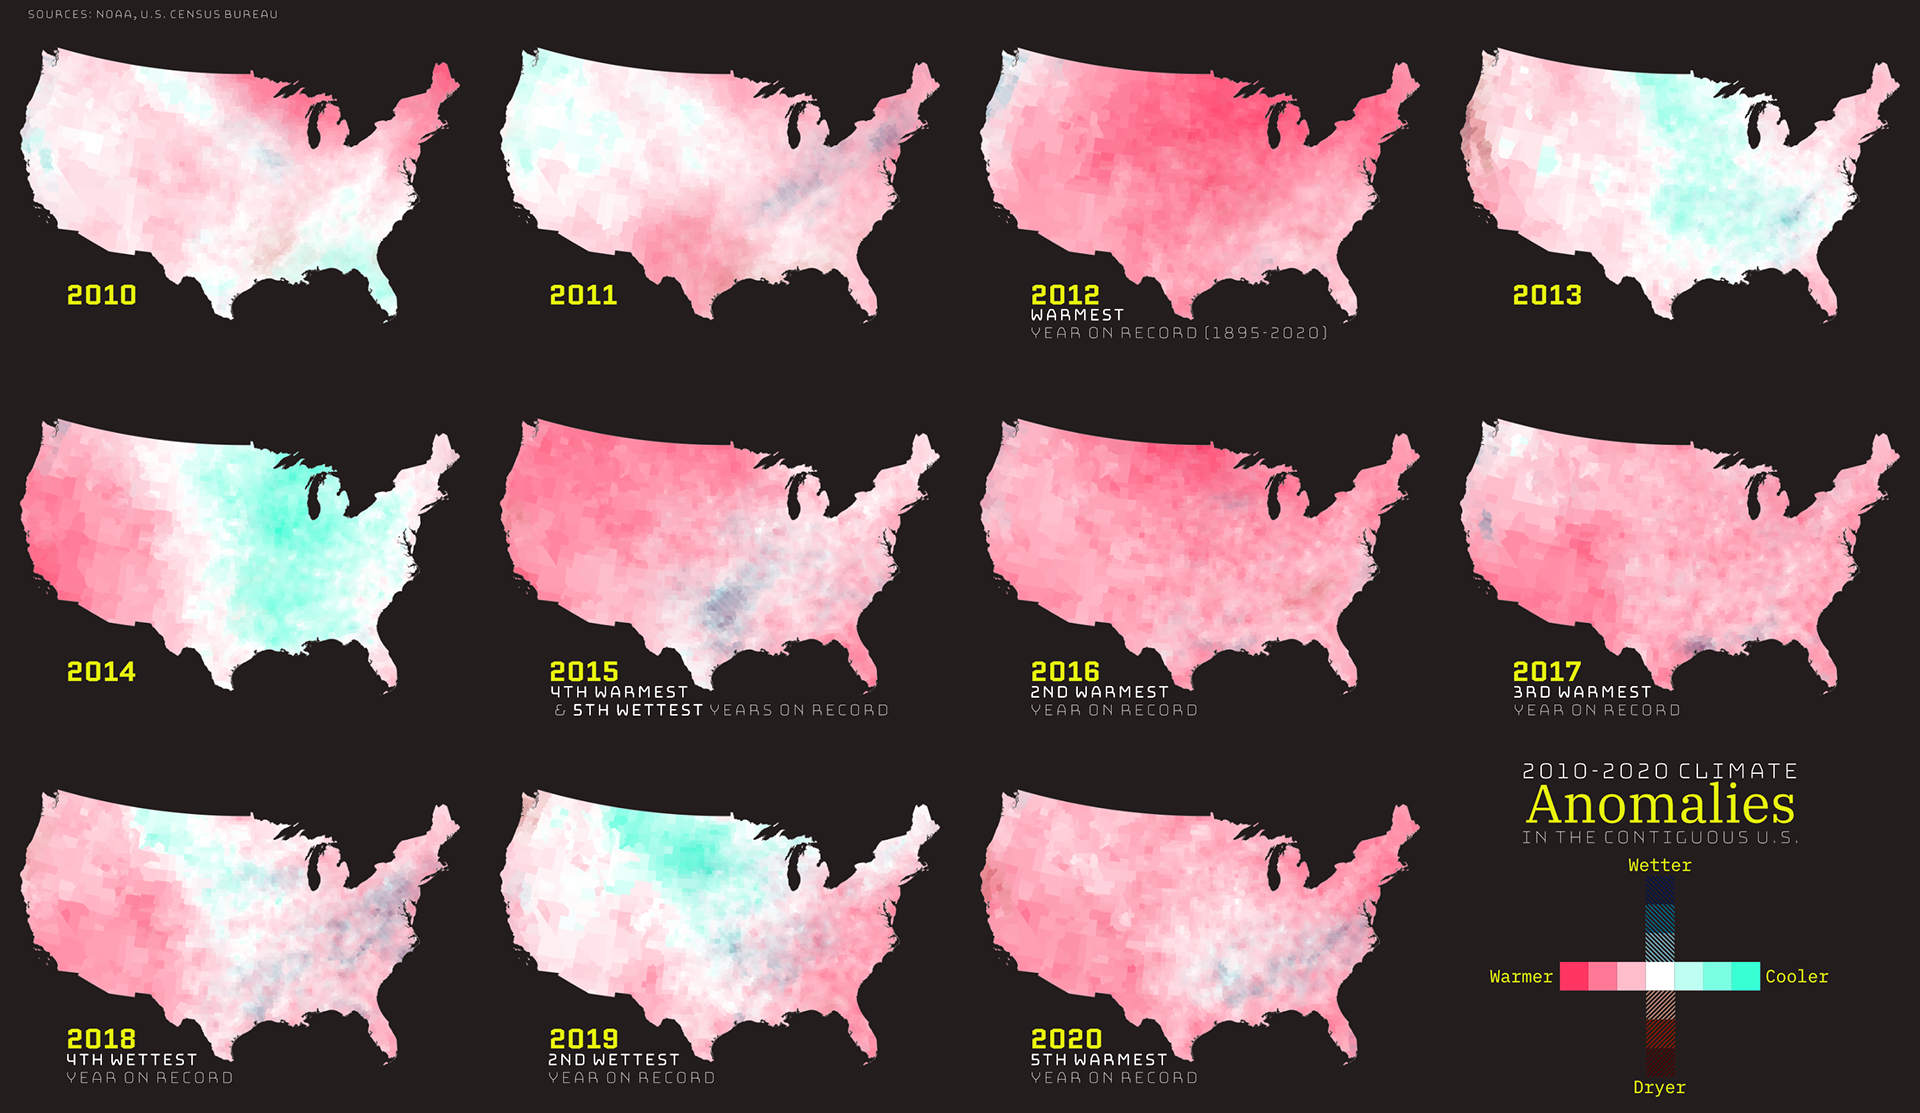
Tools: ArcGIS Pro, ArcPy, ImageMagick, Affinity Designer
Week 8 - Greyscale
Churches Per Capita

Tools: ArcGIS Pro, Adobe Photoshop, Affinity Designer